Polkadot price develops bearish divergence, hinting at 22% drop
- Polkadot price shows evidence of a bull trap.
- A bullish breakout above the Cloud is not confirmed with Polkadot’s oscillators.
- A return to volatile and indecisive price action inside the Cloud is likely.

Polkadot price is nearing an inflection point. Like a majority of the cryptocurrency market, Polkadot has paused after experiencing a massive rally. At first glance, Polkdadot appears to be in very favorable buying conditions. However, not all is as it may seem.
Polkadot hidden bearish divergence signals a warning that sellers may take control
Polkadot price has mixed signals which are likely causing frustration for buyers and sellers alike. While Polkadot has broken out above the Cloud – and even close above the Tenkan-Sen and Kijun-Sen – the Chikou Span remains in a constricted position and is neither bullish nor bearish. The oscillators, however, point to a bearish slant.
The Relative Strength Index is currently at bear market levels and shows difficulty crossing above the first overbought condition at 55. The Relative Strength Index is presently sloping down and away from the 55 level. Additionally, the Composite Index shows blatant hidden bearish divergence with lower highs printed by Polkadot price on the candlestick chart and higher highs on the Composite Index. Finally, the Optex Bands now show a sharp hook south.
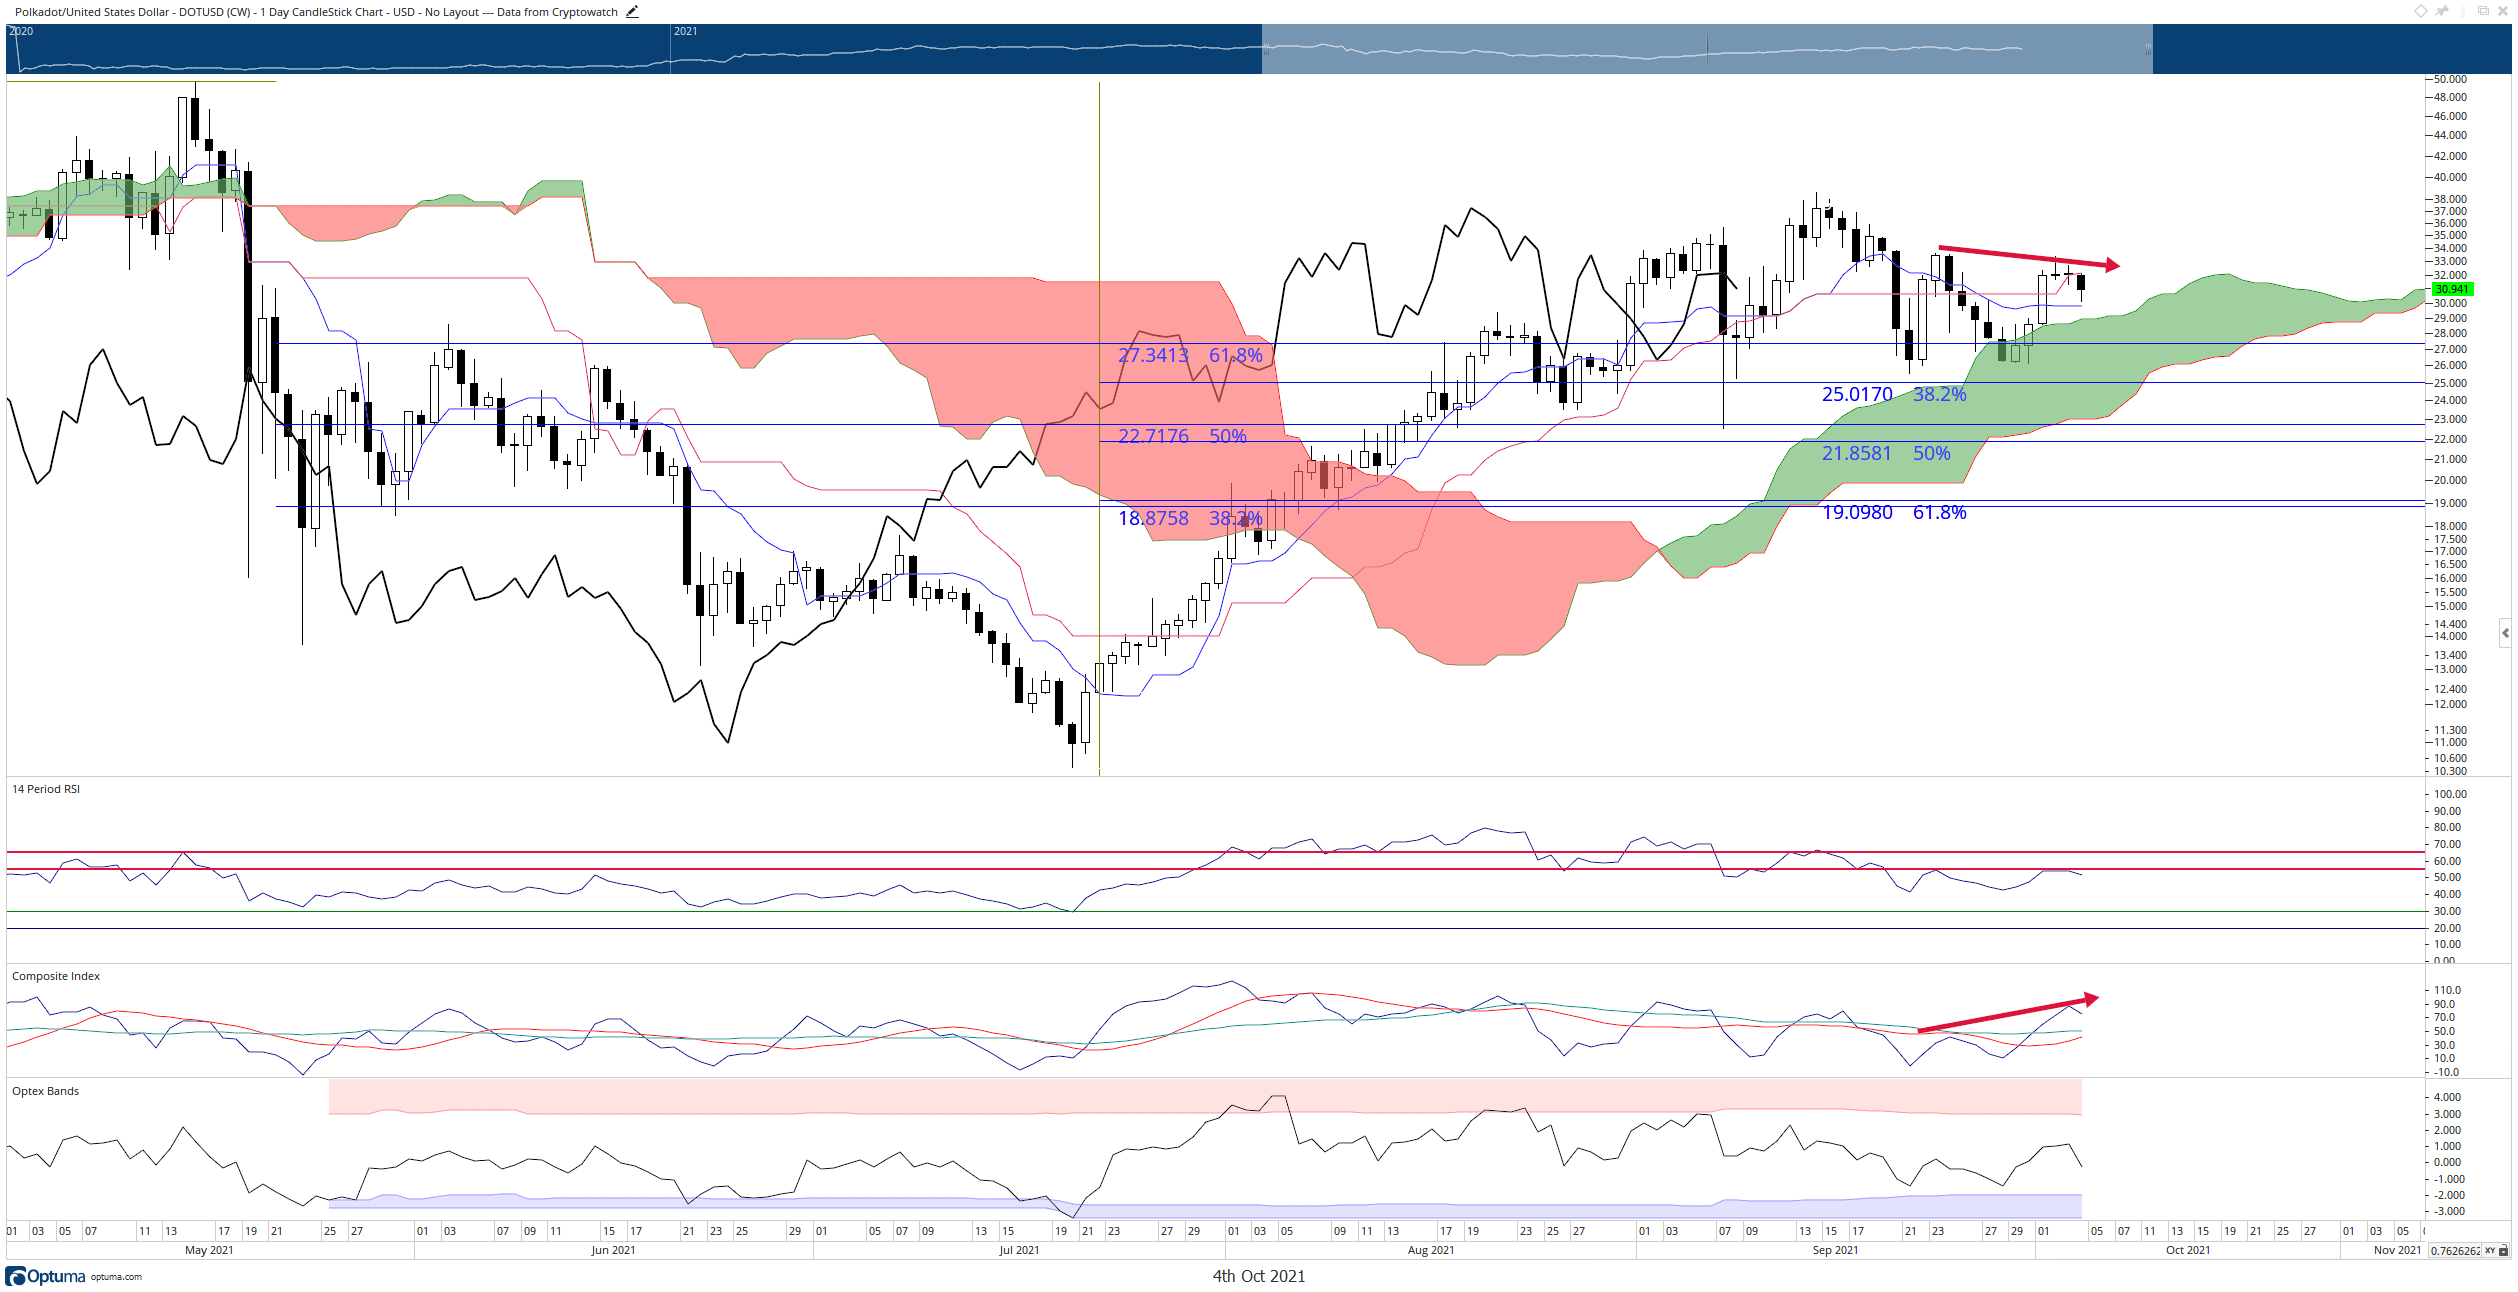
DOT/USD Daily Ichimoku Chart
One condition needs to be met to invalidate a bearish continuation move. The Chikou Span must close at a level where it will not intercept any candlesticks over the next five to ten periods. This can only occur if Polkadot price closes at or above $37.50. If this does not happen, then a return to $25.00 is more than likely to occur.
Like this article? Help us with some feedback by answering this survey:
Author

Jonathan Morgan
Independent Analyst
Jonathan has been working as an Independent future, forex, and cryptocurrency trader and analyst for 8 years. He also has been writing for the past 5 years.


