- Polkadot price approaching neckline break of a head-and-shoulders pattern.
- Chikou span below the candlesticks signals substantial and imminent price collapse soon.
- Oscillator levels support sustained selling pressure.
Polkadot price remains a laggard for how little it has moved from its recent swing highs compared to its peers. As a result, steep retracements towards the low $20 range are likely.
Polkadot price falls below 61.8% Fibonacci retracement and enters the Cloud
Polkadot price is currently under extremely bearish trading conditions within the Ichimoku Kinko Hyo system. Polkadot bulls failed to support Polkadot enough to maintain the Chikou Span above the candlesticks and instead have allowed the Chikou Span to drift well below the candlesticks.
The neckline of a head-and-shoulder pattern shares the same 27.34 value area as the 61.8% Fibonacci retracement level – a level that Polkadot price is currently trading below. The projected target zone for sellers is a zone that buyers may also find extremely attractive: $22. There is a collection of some massive support levels at the $22 value area.
There are two 50% Fibonacci retracement levels near the $22 level. The first 50% Fibonacci level is from the swing of May 15 to July 20th, while the second is from July 20th to September 14th. Between those 50% levels is the most substantial support/resistance within the Ichimoku system: Senkou Span B. Additionally, there is a high volume node at $22 as well.
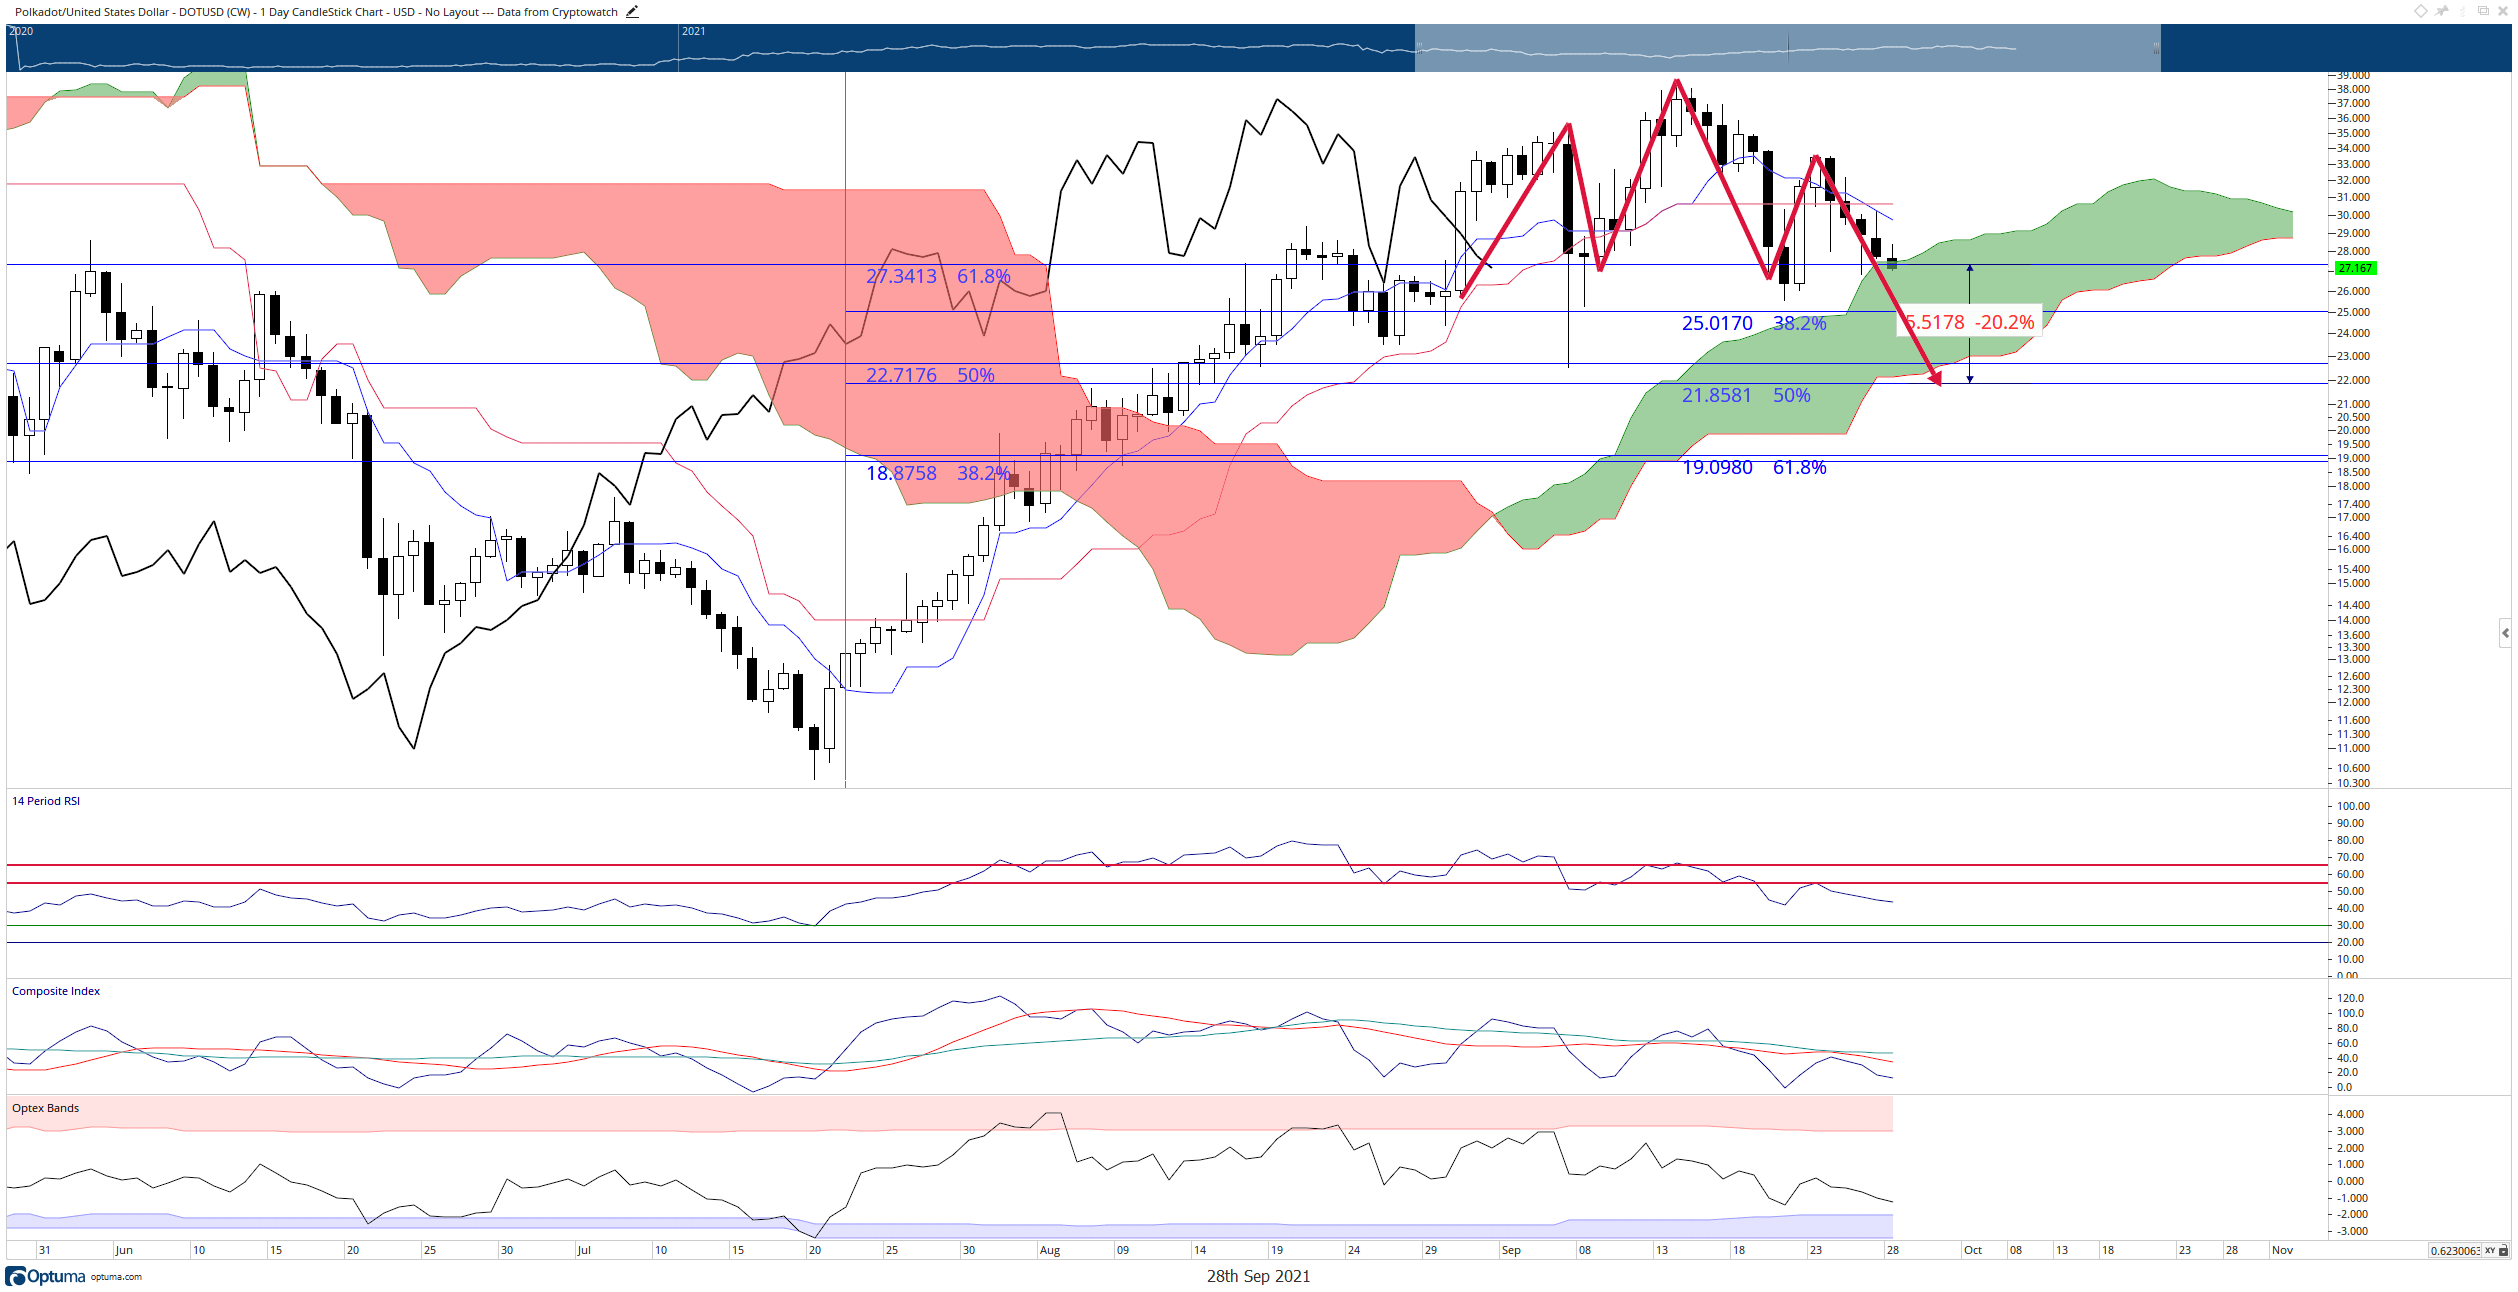
DOT/USD Daily Ichimoku Chart
Buyers anticipating a discount should be aware that as bearish as Polkadot price current is, it is not hard for Polkadot to return to a bull market. If buyers can elevate the Chikou Span to above the candlesticks ($35), nearly all conditions with the Ichimoku system for a solid bullish breakout could be met. Evidence of invalidation of any move south would be consistent daily support against Senkou Span A.
Like this article? Help us with some feedback by answering this survey:
Note: All information on this page is subject to change. The use of this website constitutes acceptance of our user agreement. Please read our privacy policy and legal disclaimer. Opinions expressed at FXstreet.com are those of the individual authors and do not necessarily represent the opinion of FXstreet.com or its management. Risk Disclosure: Trading foreign exchange on margin carries a high level of risk, and may not be suitable for all investors. The high degree of leverage can work against you as well as for you. Before deciding to invest in foreign exchange you should carefully consider your investment objectives, level of experience, and risk appetite. The possibility exists that you could sustain a loss of some or all of your initial investment and therefore you should not invest money that you cannot afford to lose. You should be aware of all the risks associated with foreign exchange trading, and seek advice from an independent financial advisor if you have any doubts.
Recommended Content
Editors’ Picks
Ripple's move above this key level could trigger nearly 50% rally for XRP
Ripple has overcome a critical resistance level and flipped into a support floor on the weekly time frame. This development happened while XRP tightly consolidated for roughly 250 days. Investors can expect XRP to kickstart a massive rally.
Optimism price outlook with nearly $90 million worth of OP tokens flooding markets on Friday
Optimism volatility has shrunk in the ours leading to the network’s cliff unlock. It joins the likes of dYdX and Sui, which have similar events on their calendars. As token unlocks are often considered bearish catalysts, investors should brace for a reaction after the event.
Top 3 Price Prediction Bitcoin, Ethereum, Ripple: Retail watches from the sidelines with a bias for shorts
Bitcoin could clear $73,777 peak as BTC bulls resurface. Ethereum might fall 10% before next leg up as ETH RSI teases with sell signal. XRP could lose $0.6000 threshold as Ripple bulls fail to show up.
Jito price could hit $6 as JTO coils up inside this bullish pattern
Jito price action shows a potential cup and handle formation. Based on theoretical measurement rules, a successful breakout could yield a 56% rally to $6.0. A breakdown of the $3.86 support level would create a lower low for JTO and invalidate the bullish thesis.
Bitcoin: BTC may have recovered, but is it out of the woods?
Bitcoin’s (BTC) upward momentum has shown a significant decline for the past two weeks or so. This development led to a bearish signal on the weekly and an uncertain outlook on the monthly.