Polkadot price controlled by bears after a strong rejection from supply zone, DOT could now be ripe for buying
- Polkadot price slipped below crucial support at $4.227, after rejection from the supply zone in August on the three-day timeframe.
- DOT could extend its fall before a potential recovery, with the RSI showing the altcoin is oversold, ripe for buying.
- Invalidation of the bearish thesis will occur if the price records a decisive three-day candlestick close above $4.500.

Polkadot (DOT) price has been on a stealth downtrend since early in the year, recording lower highs and lower lows with the upside potential capped under a descending trendline. It comes as altcoins continue to lead the cryptocurrency market crash but things could change soon as DOT seems to be coiling up for a recovery rally.
Also Read: Polkadot Price Forecast: DOT confirms trend reversal, eyes retest of $5 after reclaiming key hurdle
Polkadot price at an inflection point
Polkadot (DOT) price faced a strong rejection from the three-day supply zone lying between $4.335 and $4.631. The slump sent DOT to find support at $3.756 and is now at an inflection point, torn between a continuation south and a pullback to the forecasted $5.000 level.
In the meantime, the odds still favor the downside with the Relative Strength Index (RSI) crossing below the 30 level to show DOT remains oversold. An RSI below 30 typically indicates that an asset might be oversold and thus could be due for a rebound.With this, a pullback or correction may be underway.
Unless bullish momentum builds, the slump could extend further, sending Polkadot price below the immediate support at $3.756. A solid break and close under this level could clear the clog, likely sending DOT to the $3.000 psychological level.
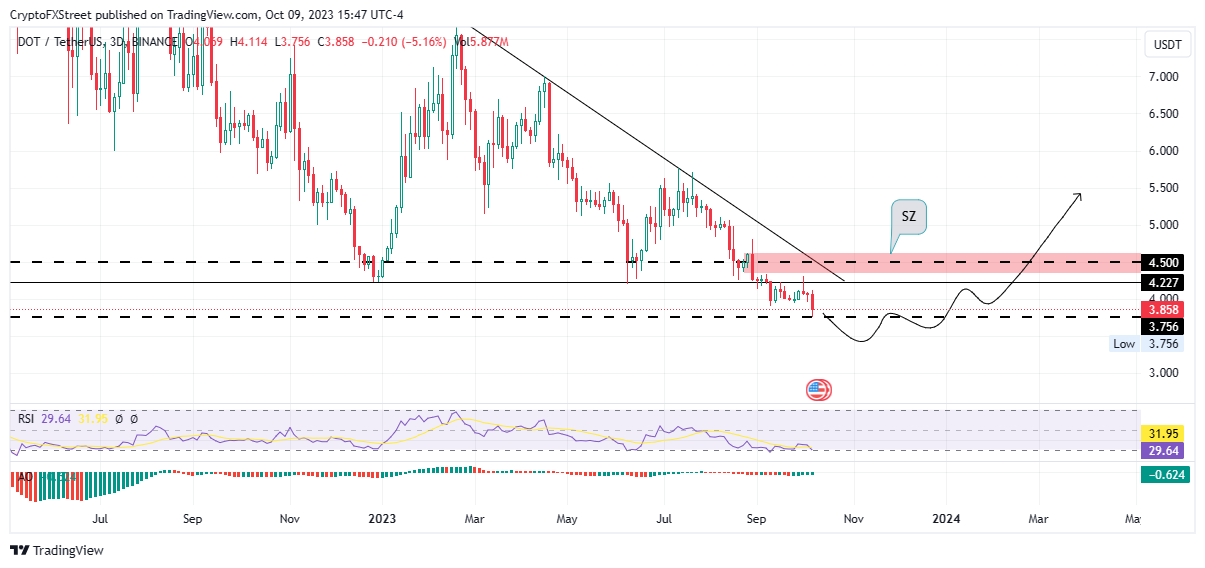
DOT/USDT 3-day chart
Conversely, if sidelined investors appreciate that DOT may be ripe for buying, and act on the bullish signal, Polkadot price could extend north, breaking past the $4.227 roadblock before extrapolating into the supply zone at $4.335.
A decisive 3-day candlestick close above the midline of this order block at $4.500 could invalidate the bearish thesis. This would clear the path for an extension to the $5.000 psychological high, and would mark the conversion of the supply zone into a bullish breaker. Such a move would constitute a 30% climb above current levels.
Bitcoin, altcoins, stablecoins FAQs
What is Bitcoin?
Bitcoin is the largest cryptocurrency by market capitalization, a virtual currency designed to serve as money. This form of payment cannot be controlled by any one person, group, or entity, which eliminates the need for third-party participation during financial transactions.
What are altcoins?
Altcoins are any cryptocurrency apart from Bitcoin, but some also regard Ethereum as a non-altcoin because it is from these two cryptocurrencies that forking happens. If this is true, then Litecoin is the first altcoin, forked from the Bitcoin protocol and, therefore, an “improved” version of it.
What are stablecoins?
Stablecoins are cryptocurrencies designed to have a stable price, with their value backed by a reserve of the asset it represents. To achieve this, the value of any one stablecoin is pegged to a commodity or financial instrument, such as the US Dollar (USD), with its supply regulated by an algorithm or demand. The main goal of stablecoins is to provide an on/off-ramp for investors willing to trade and invest in cryptocurrencies. Stablecoins also allow investors to store value since cryptocurrencies, in general, are subject to volatility.
What is Bitcoin Dominance?
Bitcoin dominance is the ratio of Bitcoin's market capitalization to the total market capitalization of all cryptocurrencies combined. It provides a clear picture of Bitcoin’s interest among investors. A high BTC dominance typically happens before and during a bull run, in which investors resort to investing in relatively stable and high market capitalization cryptocurrency like Bitcoin. A drop in BTC dominance usually means that investors are moving their capital and/or profits to altcoins in a quest for higher returns, which usually triggers an explosion of altcoin rallies.
Author

Lockridge Okoth
FXStreet
Lockridge is a believer in the transformative power of crypto and the blockchain industry.



