Polkadot price confronts a challenge, as catalysts for DOT correction multiply
- Polkadot price reaches for the 50% retracement of the May-July cyclical correction, but the 200-day simple moving average (SMA) pulls on it.
- DOT holds the July ascending trend line, provoking an extreme overbought condition on the daily Relative Strength Index (RSI).
- DOT is heading into the weekend with the potential to close with five consecutive positive weeks for the first time.

Polkadot price has realized a tremendous run since the July low, recording a 185% gain at today’s high. The rally has been interrupted by only seven negative days as it stretches to overtake the 200-day SMA on a daily closing basis. However, the alignment of the 200-day SMA with several highs in late May and June creates the first credible resistance for DOT since the July 7 high of $17.88. Simultaneously, the six-hour chart is flashing a bearish momentum divergence, intensifying the challenge now emerging for the digital coin.
Polkadot price rewrites the meaning of relentless
Polkadot price has established a leadership position for the cryptocurrency market, rising 185% since the July low while maintaining constant support at or near the July ascending trend line. The relentlessness of the rally has overtaken the resistance defined by the 38.2% Fibonacci retracement of the May-July correction at $25.78 and potentially the 200-day SMA today at $27.54 (depends on today's close).
A potential warning for future Polkadot price exploits is the emergence of a bearish momentum divergence on the six-hour chart at today’s high. The bearish momentum divergences at the August 7 and August 11 highs resulted in 14% and 12% pullbacks, respectively, but in neither case was DOT attempting to overcome a level or range of resistance as is the case now.
A pullback of 14% would drag Polkadot price below the July ascending trend line and put DOT within striking distance of the 50 six-hour SMA at $22.97.
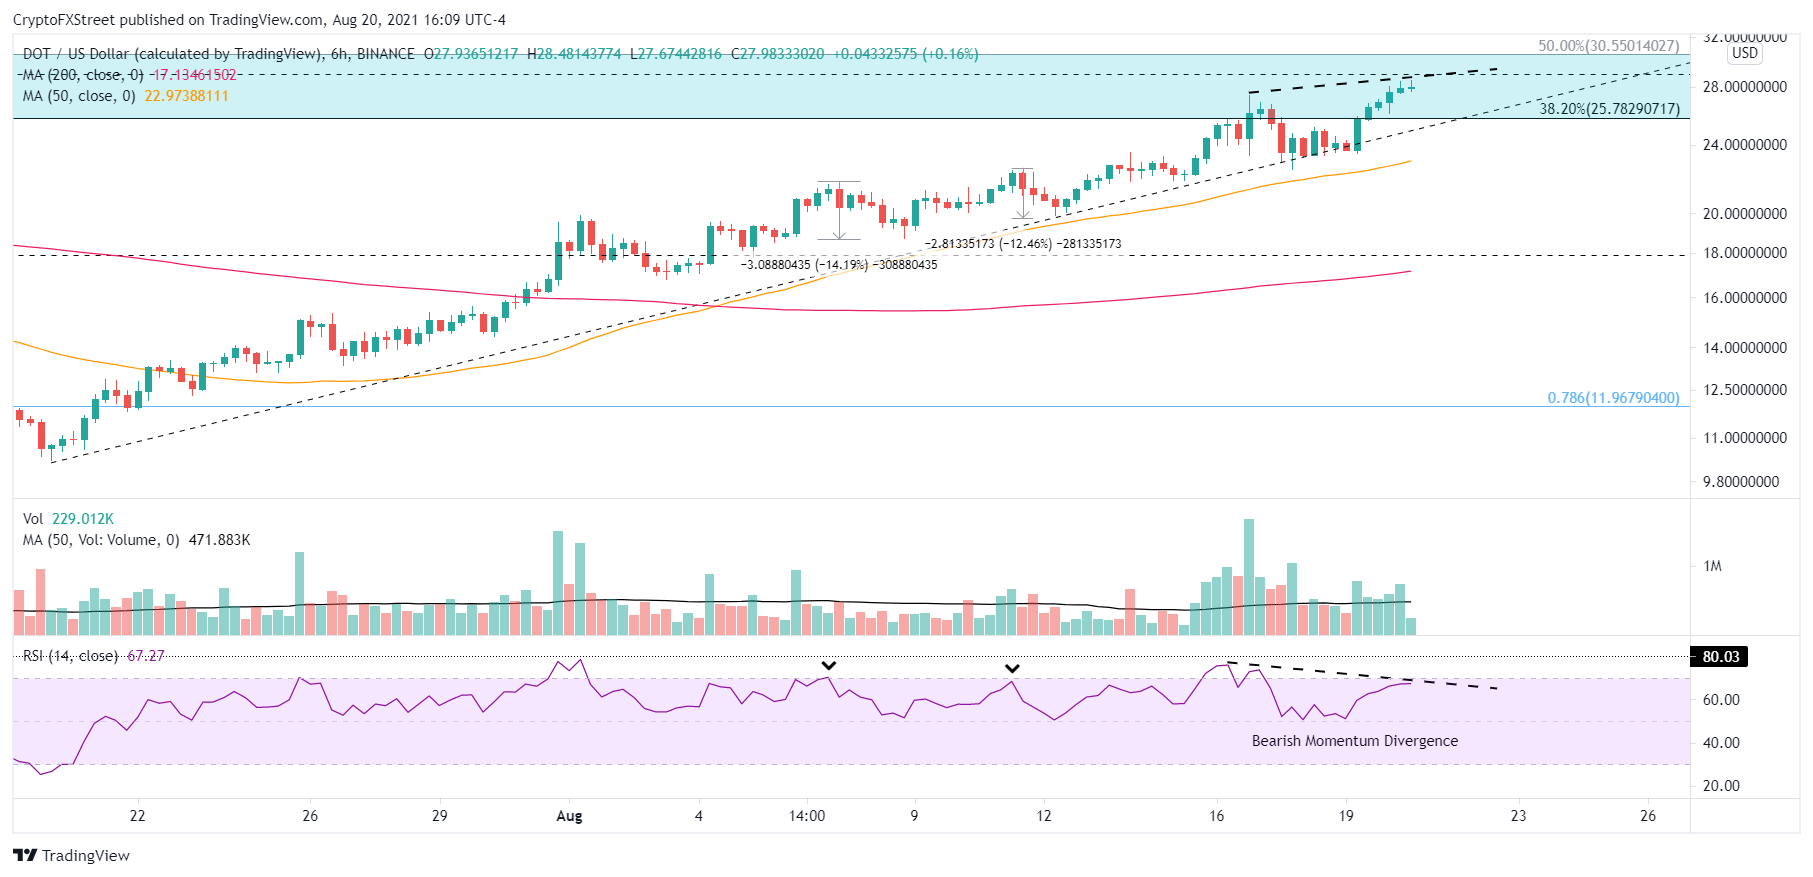
DOT/USD 6-hour chart
On the daily chart, Polkadot price has not registered a bearish momentum divergence. Instead, the daily RSI is nearing the highest reading since the February high, signaling an extreme overbought condition and raising the probabilities for a DOT reversal. The extreme reading coincides with today’s effort to clear the 200-day SMA and make a run to the 50% retracement of the May-July correction at $30.55.
Adding to the complexity on the DOT charts is the presence of Polkadot price congestion between the 38.2% and 50% retracement levels going back to the beginning of the year, including the late February low and the March and April lows. The price congestion halted the rebound following the May 19 collapse and two bounces in June.
To confirm the cautious outlook, Polkadot price needs to record a daily close below the 38.2% retracement level and the July ascending trend line, now at $24.57.
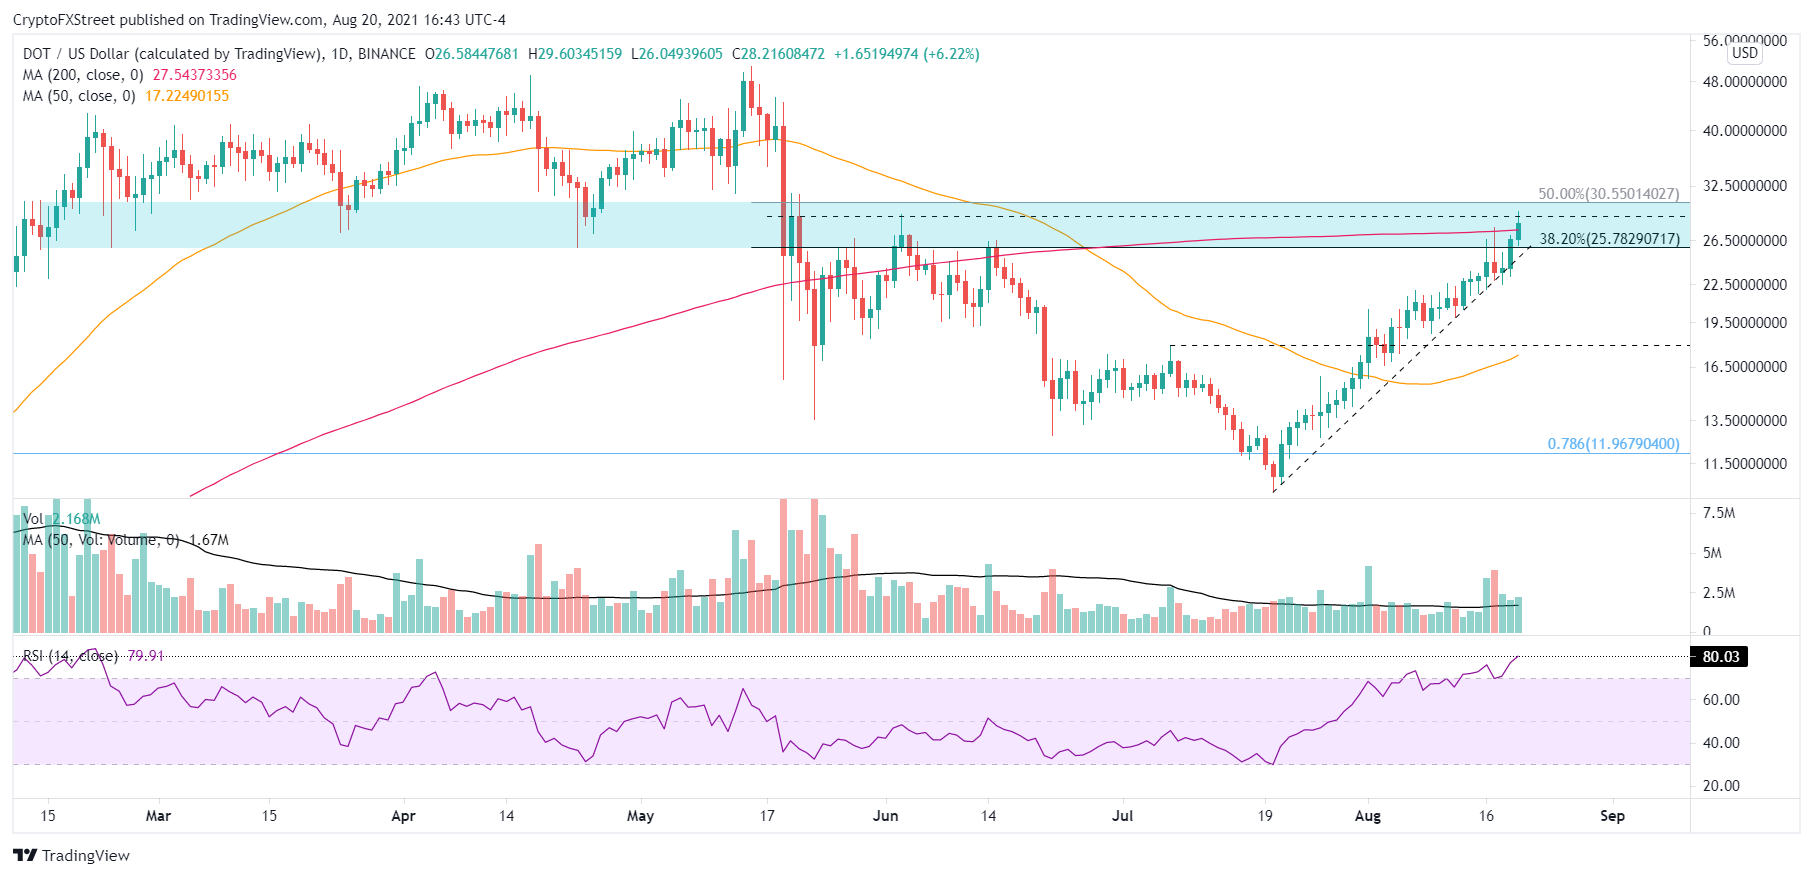
DOT/USD daily chart
A daily close above the 50% retracement at $30.55 would negate the cautious outlook and turn the resistance range into support, projecting better Polkadot price outcomes moving forward.
The catalysts are in place for a longer and deeper Polkadot price retracement, an extreme overbought reading on the daily RSI, the bearish momentum divergence on the DOT six-hour chart and the convergence of several significant highs and lows between the two Fibonacci levels.
Author

Sheldon McIntyre, CMT
Independent Analyst
Sheldon has 24 years of investment experience holding various positions in companies based in the United States and Chile. His core competencies include BRIC and G-10 equity markets, swing and position trading and technical analysis.


