Polkadot must break through crucial resistance for DOT price to hit $61
- Polkadot price continues to test prior ascending wedge trend lines as resistance.
- Higher highs and higher lows point to sustained growth and valuations.
- An extremely bullish Point and Figure pattern could initiate a breakout.

Polkadot price continues to churn higher in the $40 price range and seeks to push beyond the current consolidation. But first, Polkadot needs to break through the resistance levels that continue to prevent a significant, monstrous bullish break.
Polkadot price continues to assault prior trendlines; a breakout could occur soon
Polkadot price action has been a source of frustration for short-sellers. There have been multiple, solid opportunities for Polkadot to experience a major collapse, but all have failed. Buyers are firm and continue to buy any small dips in the $40 value area. Short sellers have been most active when Polkadot approaches the trendlines of a previous rising wedge. On the Point and Figure chart below, there have four attempts to break above the trendlines and four rejections. Polkadot is approaching its fifth and possibly final attempt.
The hypothetical trade idea shows a probable entry at $47. The entry is based on the break of a double-top. Usually, a double-top is not enough reason to take an entry, but one more pattern makes the $47 entry appropriate. The current X column entry would confirm a Bear Trap pattern because the last O-column created an O below the double bottom but failed to move lower. Because of the Bear Trap pattern, additional momentum from trapped shorts will be crucial in Polkadot breaking out above the trendlines.
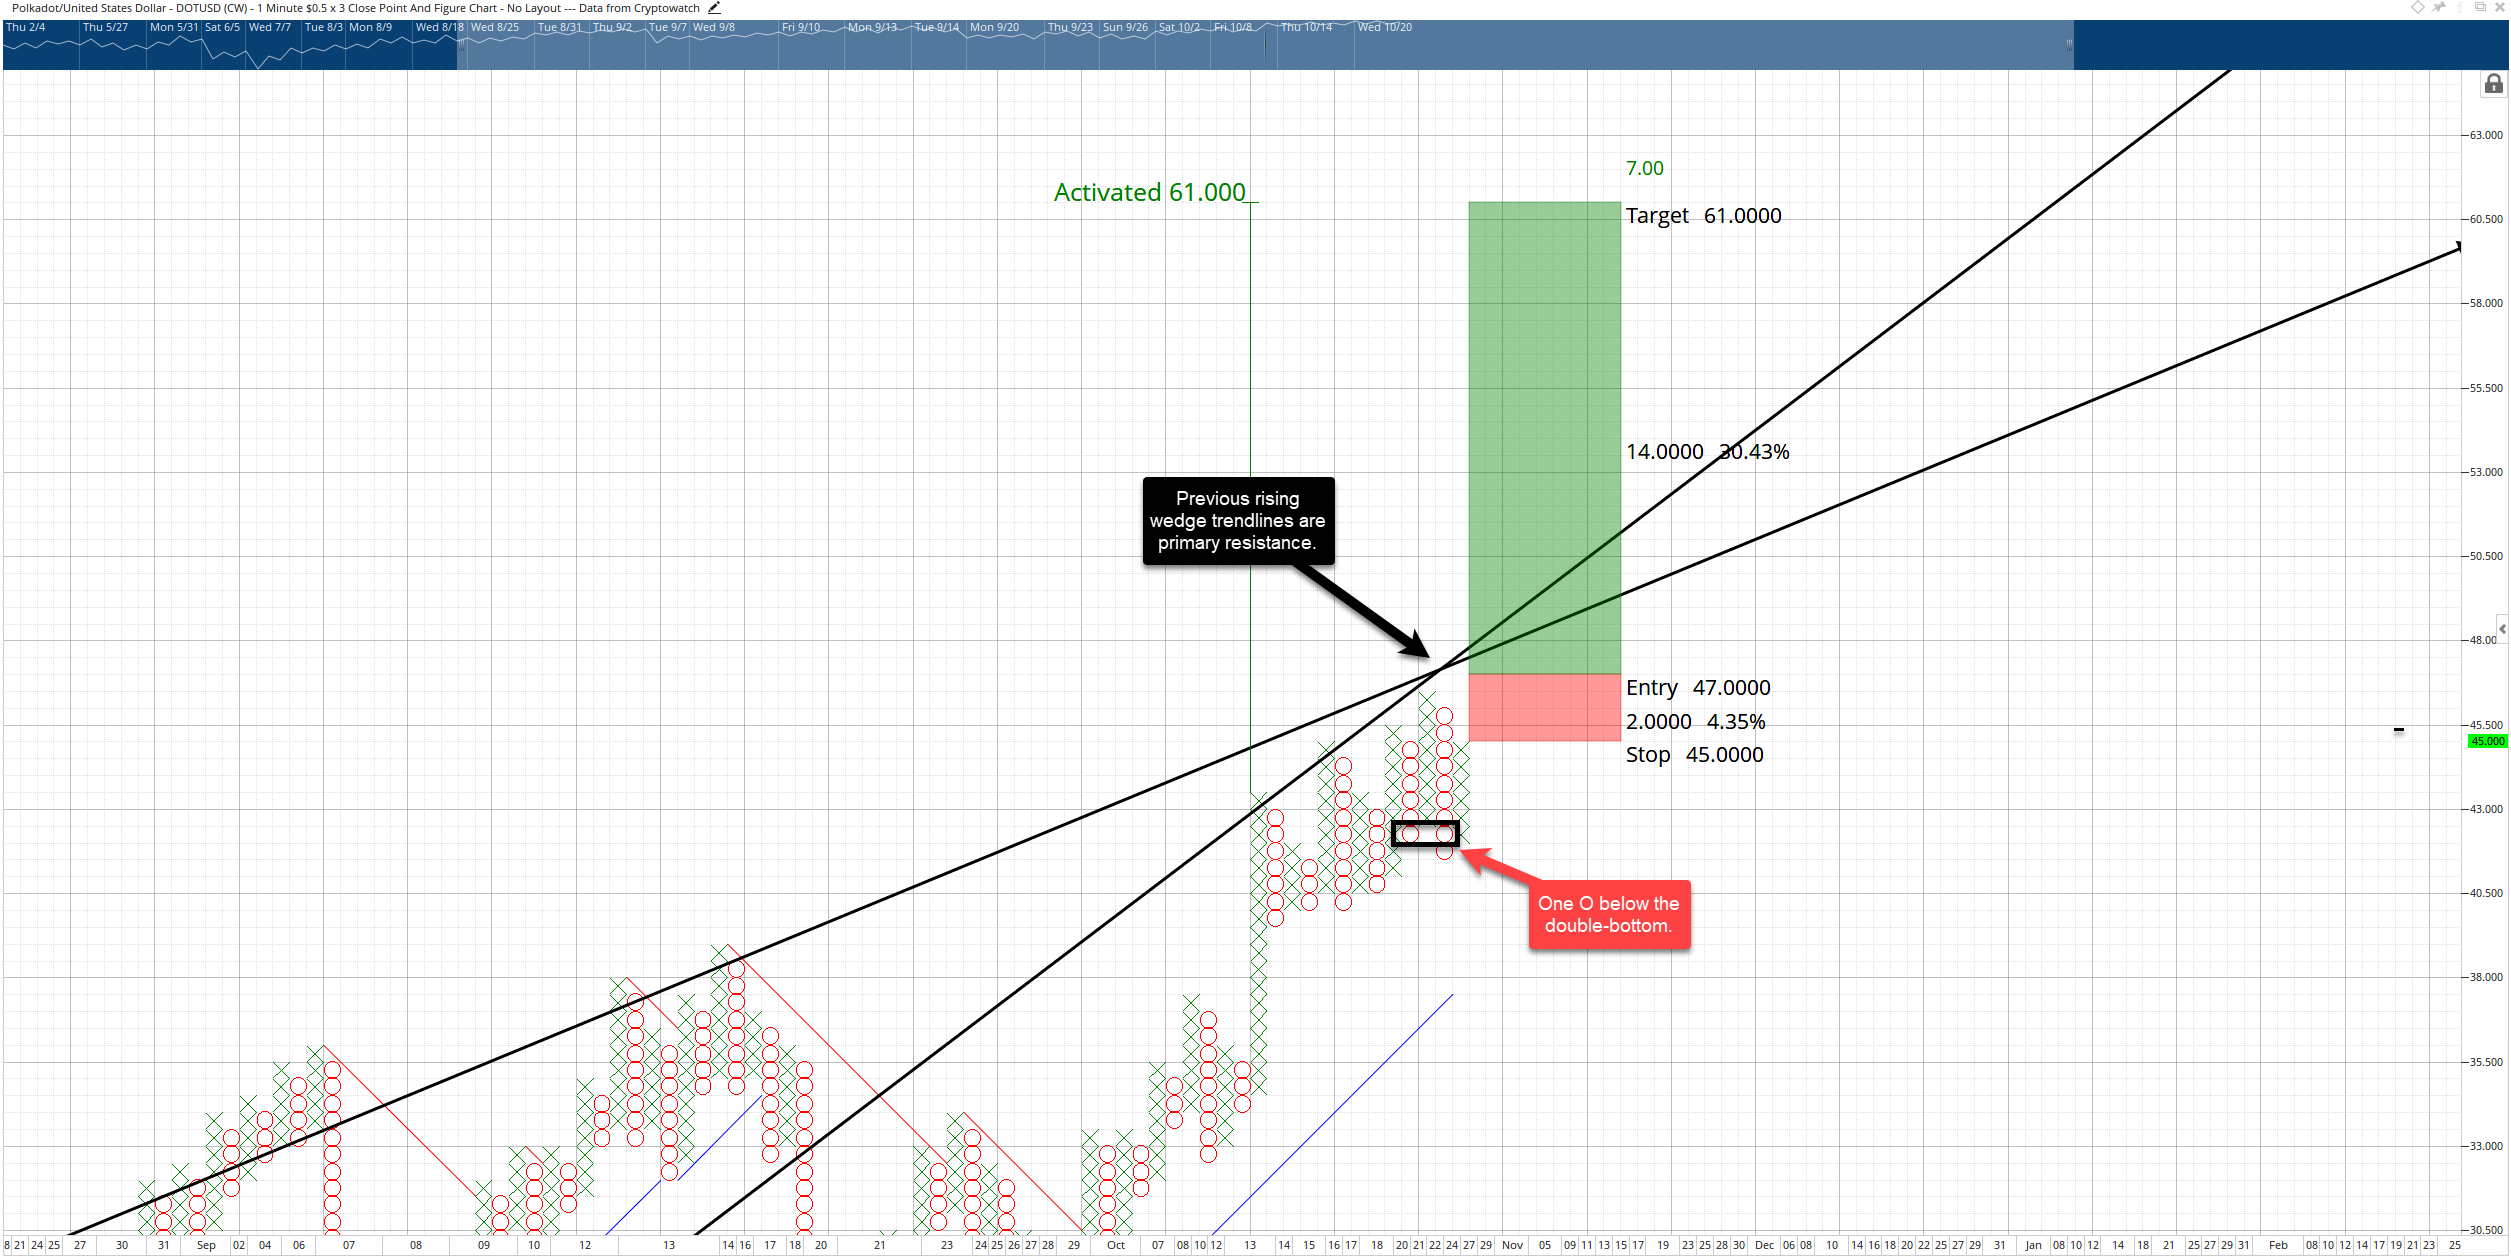
DOT/USDT $0.50/3-box Reversal Point and Figure Chart
However, caution should always be practiced. The consistent rejection is a sign of strength and adds to the power of the resistance at the trendlines. Traders will want to watch for any selling pressure that would push Polkdaot price back to $41 as this could trigger a robust corrective move to the mid-$30 range.
Author

Jonathan Morgan
Independent Analyst
Jonathan has been working as an Independent future, forex, and cryptocurrency trader and analyst for 8 years. He also has been writing for the past 5 years.


