Polkadot Elliott Wave technical analysis [Video]
![Polkadot Elliott Wave technical analysis [Video]](https://editorial.fxsstatic.com/images/i/DOT-bullish-object_XtraLarge.png)
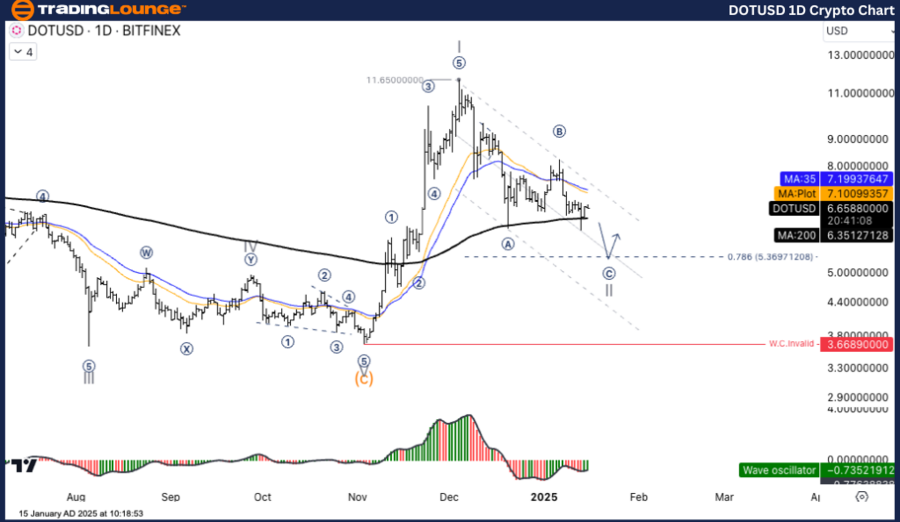
Elliott Wave Analysis TradingLounge.
DOT/USD Elliott Wave technical analysis
Function: Counter Trend.
Mode: Corrective.
Structure: Zigzag.
Position: Wave ((C)).
Direction Next higher degrees: Wave II.
DOT/ U.S. dollar (DOTUSD) Trading Strategy: Price is likely to move down in wave C with a target at the support level of 5.3691 which is a 78.6% Fibonacci level. After the end of wave C and the wave (II) structure, price is expected to enter a new uptrend in wave (III).
Main outlook
-
Short term: Price remains in a downtrend in wave C.
-
Long term: After the end of the correction, the price has a chance to enter a new uptrend in wave (III), which is the main trend in the major structure.
DOT/USD Elliott Wave technical analysis
Function: Counter Trend
Mode: Corrective
Structure: Zigzag
Position: Wave ((C))
Direction Next higher Degrees: Wave II
DOT/ U.S. dollar (DOTUSD) Trading Strategy: Price is likely to move down in wave C with a target at the support level of 5.3691 which is a 78.6% Fibonacci level. After the end of wave C and the wave (II) structure, price is expected to enter a new uptrend in wave (III).
Main outlook
-
Short term: Price remains in a downtrend in wave C.
-
Long term: After the end of the correction, the price has a chance to enter a new uptrend in wave (III), which is the main trend in the major structure.

Polkadot Elliott Wave technical analysis [Video]
Author

Peter Mathers
TradingLounge
Peter Mathers started actively trading in 1982. He began his career at Hoei and Shoin, a Japanese futures trading company.


