Polkadot Elliott Wave technical analysis [Video]
![Polkadot Elliott Wave technical analysis [Video]](https://editorial.fxstreet.com/images/Markets/Currencies/Cryptocurrencies/Polkadot/polkadot-150x150logo-637399979978734311_XtraLarge.png)
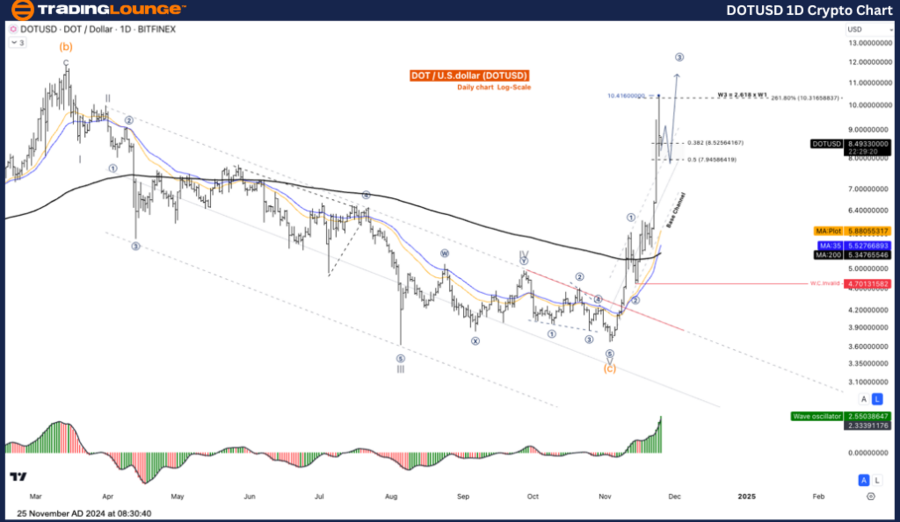
DOT/USD Elliott Wave technical analysis
Function: Follow Trend.
Mode: Motive.
Structure: Impulse.
Position: Wave ((1)).
Direction next higher degrees: wave I of Impulse.
Details: the corrective of wave 2 May is ending and the price increase again in wave 3.
DOT/ US Dollar (DOT/USD) trading strategy: Overview DOTUSD remains in an uptrend, likely to surge sharply from the third wave surge, so look for opportunities to join the uptrend from a short-term pullback.
DOT/ US Dollar (DOT/USD) technical indicators: The price is above the MA200 indicating an uptrend, The Wave Oscillator is a Bullish Momentum.
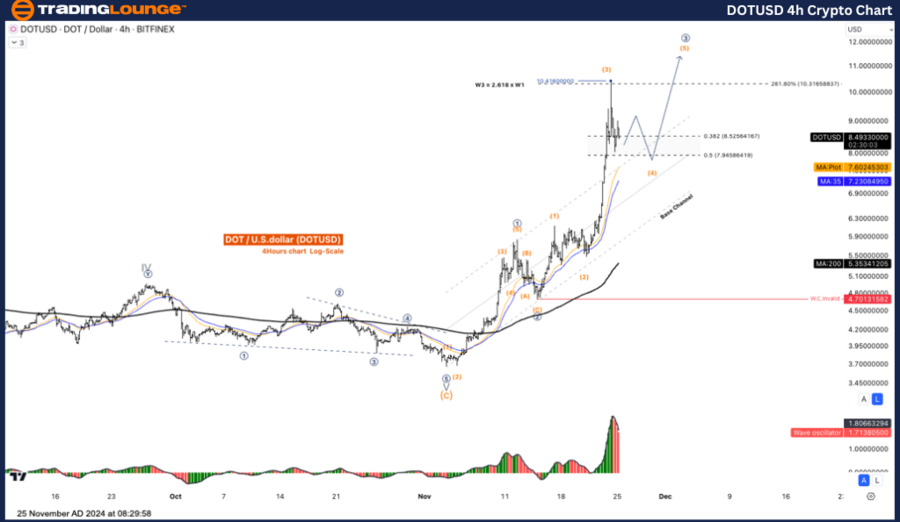
DOT/USD Elliott Wave technical analysis
Function: Counter Trend.
Mode: Corrective.
Structure: Zigzag.
Position: Wave (c).
Direction next higher degrees: Wave 3 of Impulse.
Details: the corrective of wave 2 May is ending and the price increase again in wave 3.
DOT/ US Dollar (DOT/USD) trading strategy: Overview DOTUSD remains in an uptrend, likely to surge sharply from the third wave surge, so look for opportunities to join the uptrend from a short-term pullback.
DOT/ US Dollar (DOT/USD) technical indicators: The price is above the MA200 indicating an uptrend, The Wave Oscillator is a Bullish Momentum.
Polkadot Elliott Wave technical analysis [Video]
Author

Peter Mathers
TradingLounge
Peter Mathers started actively trading in 1982. He began his career at Hoei and Shoin, a Japanese futures trading company.


