Polkadot Elliott Wave technical analysis [Video]
![Polkadot Elliott Wave technical analysis [Video]](https://editorial.fxstreet.com/images/Markets/Currencies/Cryptocurrencies/Polkadot/polkadot-150x150logo-637399979978734311_XtraLarge.png)
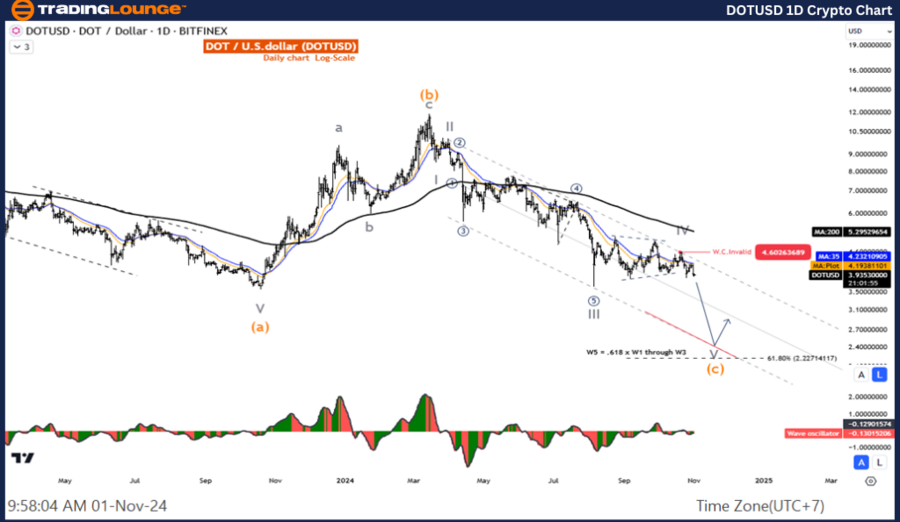
DOT/USD Elliott Wave technical analysis
Function: Follow Trend.
Mode: Motive.
Structure: Impulse.
Position: Wave V.
Direction next higher degrees: Wave (C).
Details: The five-wave falling in wave V.
Five wave V retracement, the final wave of wave C before resuming the uptrend. We expect the price to drop to test the 2.227 level, so the overall picture is still a short-term decline before resuming the uptrend.
DOT/ U.S. dollar (DOT/USD) Technical Indicators: The price is below the MA200 indicating a downtrend, The Wave Oscillator is a Bearish Momentum.
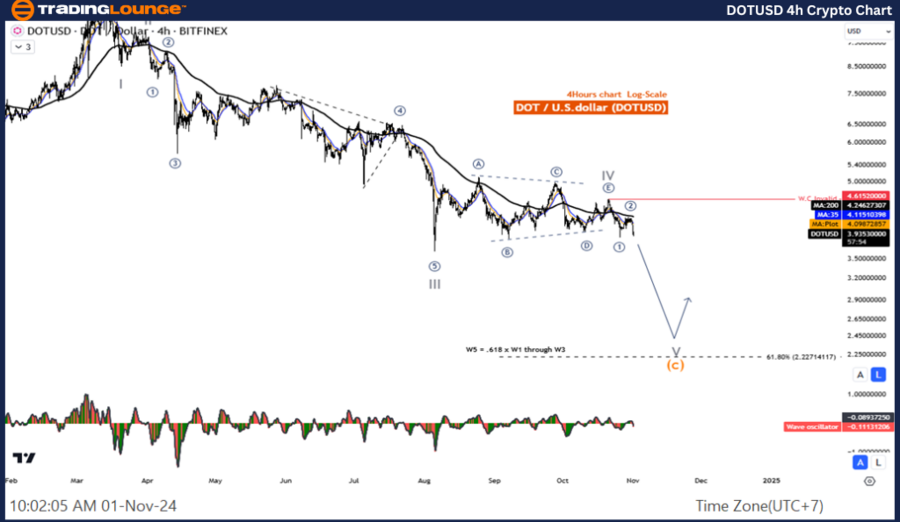
DOT/USD Elliott Wave technical analysis
Function: Follow Trend
Mode: Motive
Structure: Impulse
Position: Wave V
Direction next higher degrees: Wave (C)
Details: The five-wave falling in wave V.
DOT/ U.S. dollar (DOT/USD) Trading Strategy: Five wave V retracement, the final wave of wave C before resuming the uptrend. We expect the price to drop to test the 2.227 level, so the overall picture is still a short-term decline before resuming the uptrend.
DOT/ U.S. dollar (DOT/USD) Technical Indicators: The price is below the MA200 indicating a downtrend, The Wave Oscillator is a Bearish Momentum.
Polkadot Elliott Wave technical analysis [Video]
Author

Peter Mathers
TradingLounge
Peter Mathers started actively trading in 1982. He began his career at Hoei and Shoin, a Japanese futures trading company.


