- Polkadot price broke below the 55-day SMA and the monthly pivot.
- DOT price keeps trading lower as RSI shows no signs of any increase on the buy-side volume.
- Expect a further leg lower and possible acceleration of the down move with a 20% depreciation.
Polkadot (DOT) is under pressure as bears have reversed the uptrend and are now looking to push DOT price lower. Bulls can defend support at $37, but if that breaks, another big chunk of devaluation could follow. Expect traders not to catch the falling knife and instead look for the current correction to unfold in full before stepping in and buying back into an extended position again.
Polkadot price bears chasing the 20% devaluation before bulls will look for entries
Polkadot price broke back below the $45.22 level a few days ago but did not stop to consolidate below it, and yesterday the correction extended a further 15% in just one day. The pain does not look over yet for DOT price as, whilst the monthly pivot could slow down the nosedive, there is still the possibility of another break below its support at $39.50.
DOT price looks to be in a downtrend now with downside pressure increasing and the Relative Strength Index not showing an uptick on the buy-side. Expect a retest of $37.03, followed by a break and further acceleration of the sell-off. With that move, another 20% devaluation will hit DOT price and see bulls getting out of the way until the price reaches $31.61.
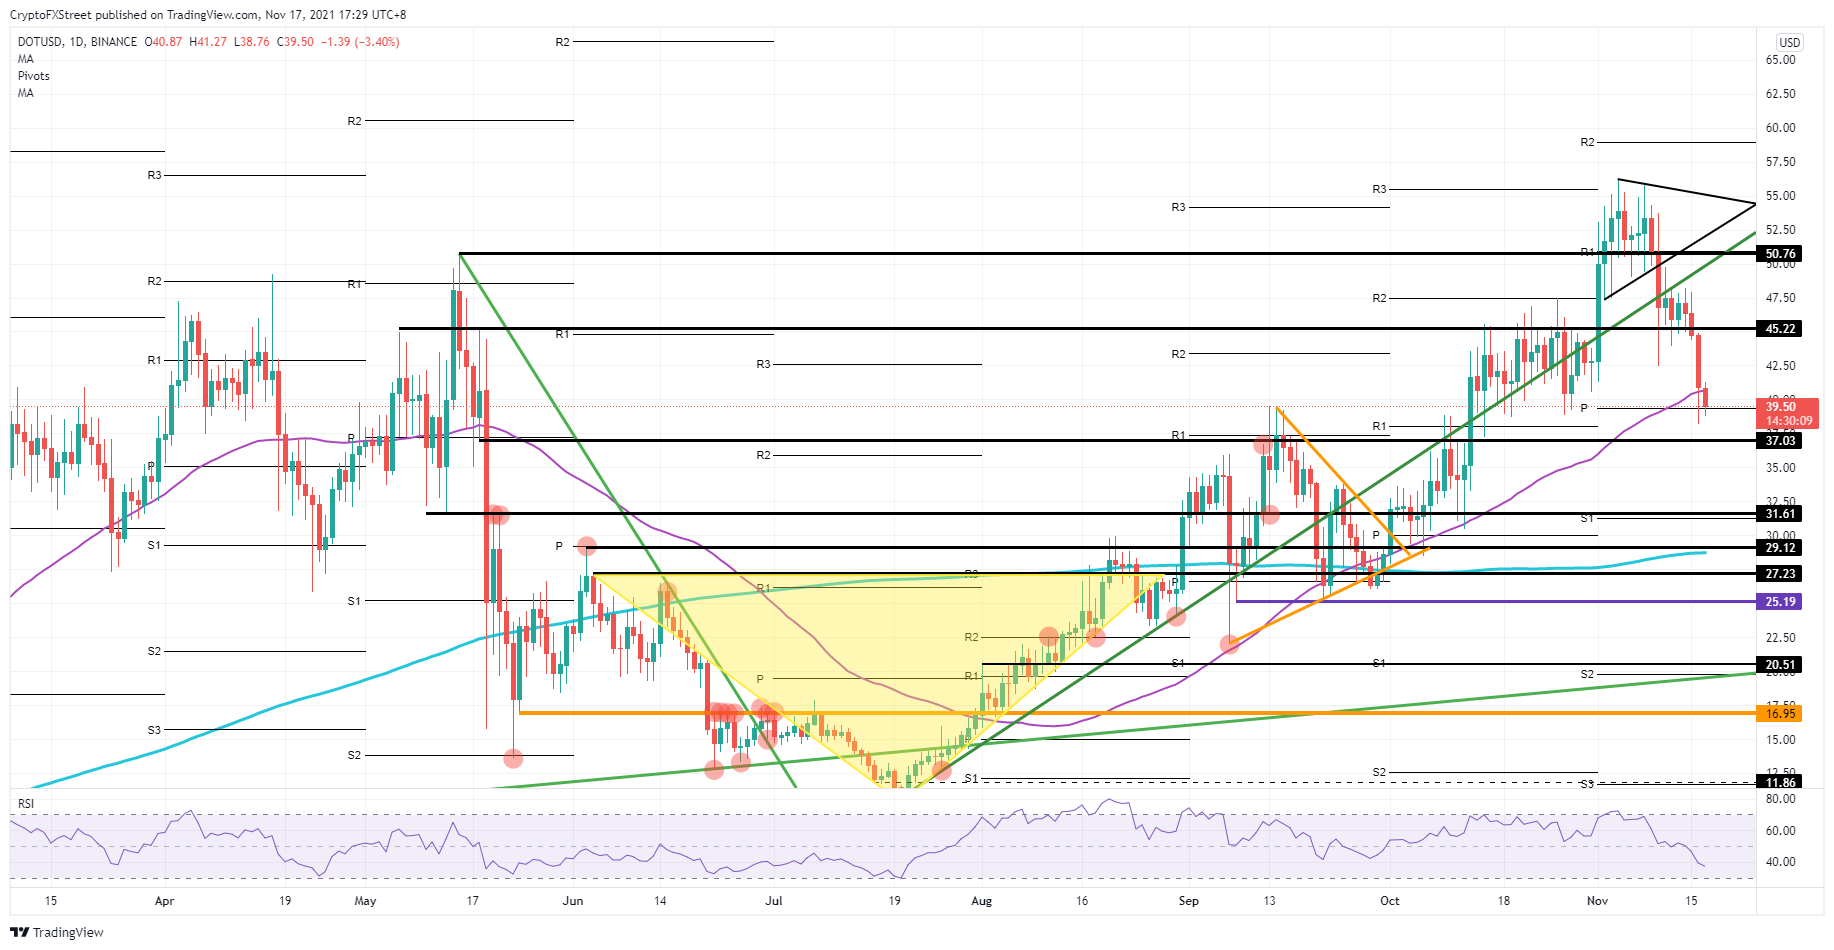
DOT/USD daily chart
Once DOT price trades between $31.61 and $29.12, bulls will start to build a fade-in trade with the $30 big figure as psychological support and incentive for bulls to go long. With that price correction, the RSI will be trading in an oversold area and will not attract more bears to the scene as the indicator will be signalling further downtrend profit will be limited. This should then see bulls gaining back some ground towards $37.03.
Information on these pages contains forward-looking statements that involve risks and uncertainties. Markets and instruments profiled on this page are for informational purposes only and should not in any way come across as a recommendation to buy or sell in these assets. You should do your own thorough research before making any investment decisions. FXStreet does not in any way guarantee that this information is free from mistakes, errors, or material misstatements. It also does not guarantee that this information is of a timely nature. Investing in Open Markets involves a great deal of risk, including the loss of all or a portion of your investment, as well as emotional distress. All risks, losses and costs associated with investing, including total loss of principal, are your responsibility. The views and opinions expressed in this article are those of the authors and do not necessarily reflect the official policy or position of FXStreet nor its advertisers. The author will not be held responsible for information that is found at the end of links posted on this page.
If not otherwise explicitly mentioned in the body of the article, at the time of writing, the author has no position in any stock mentioned in this article and no business relationship with any company mentioned. The author has not received compensation for writing this article, other than from FXStreet.
FXStreet and the author do not provide personalized recommendations. The author makes no representations as to the accuracy, completeness, or suitability of this information. FXStreet and the author will not be liable for any errors, omissions or any losses, injuries or damages arising from this information and its display or use. Errors and omissions excepted.
The author and FXStreet are not registered investment advisors and nothing in this article is intended to be investment advice.
Recommended Content
Editors’ Picks
Ripple's move above this key level could trigger nearly 50% rally for XRP
Ripple has overcome a critical resistance level and flipped into a support floor on the weekly time frame. This development happened while XRP tightly consolidated for roughly 250 days. Investors can expect XRP to kickstart a massive rally.
Optimism price outlook with nearly $90 million worth of OP tokens flooding markets on Friday
Optimism volatility has shrunk in the ours leading to the network’s cliff unlock. It joins the likes of dYdX and Sui, which have similar events on their calendars. As token unlocks are often considered bearish catalysts, investors should brace for a reaction after the event.
Top 3 Price Prediction Bitcoin, Ethereum, Ripple: Retail watches from the sidelines with a bias for shorts
Bitcoin could clear $73,777 peak as BTC bulls resurface. Ethereum might fall 10% before next leg up as ETH RSI teases with sell signal. XRP could lose $0.6000 threshold as Ripple bulls fail to show up.
Jito price could hit $6 as JTO coils up inside this bullish pattern
Jito price action shows a potential cup and handle formation. Based on theoretical measurement rules, a successful breakout could yield a 56% rally to $6.0. A breakdown of the $3.86 support level would create a lower low for JTO and invalidate the bullish thesis.
Bitcoin: BTC may have recovered, but is it out of the woods?
Bitcoin’s (BTC) upward momentum has shown a significant decline for the past two weeks or so. This development led to a bearish signal on the weekly and an uncertain outlook on the monthly.