|

PEPE price in for steep correction after nearly doubling in three days

  • PEPE price rallied 95% between June 20 and 23, pushing it from $0.000000918 to $0.00000178.
  • This ascent shattered through many hurdles, but the Wave Trend indicator is now flashing a sell signal. 
  • Investors can expect the frog-based meme coin to retrace to the $0.00000147 and $0.00000127 support levels. 

PEPE price nearly doubled between June 20 and 23, suggesting a massive interest in the meme coin. However, due to the weekend, the volatility has dried up, and indicators are suggesting that the altcoin is ready for a correction. 

Also read: Pepe price resumes bullish impetus as PEPE holder count edges toward 20,000

PEPE price ready to take a break

PEPE price was on a steady downtrend between May 13 and June 15, which caused the altcoin to shed 60% of its market value. After creating a local bottom at $0.000000829, the frog-based meme decided to reverse the trend.

Between June 15 and June 23, PEPE price shot up 117%, but this impressive rally picked up steam on June 20 and rallied nearly 95% in just three days.  As the PEPE hovers below $0.00000164 resistance levels, investosr need to pay attention to the indicators.

The Relative Strength Index (RSI) is present above the overbought zone, indicating that the altcoin is due for a correction. Likewise, the Awesome Oscillator (AO) indicator has also started producing red histograms that are declining in height, revealing a declining bullish momentum.

The last nail in the bulls’ coffin is the Wave Trend indicator’s bearish crossover above the overbought zone, which indicates that PEPE price is ready for a correction.
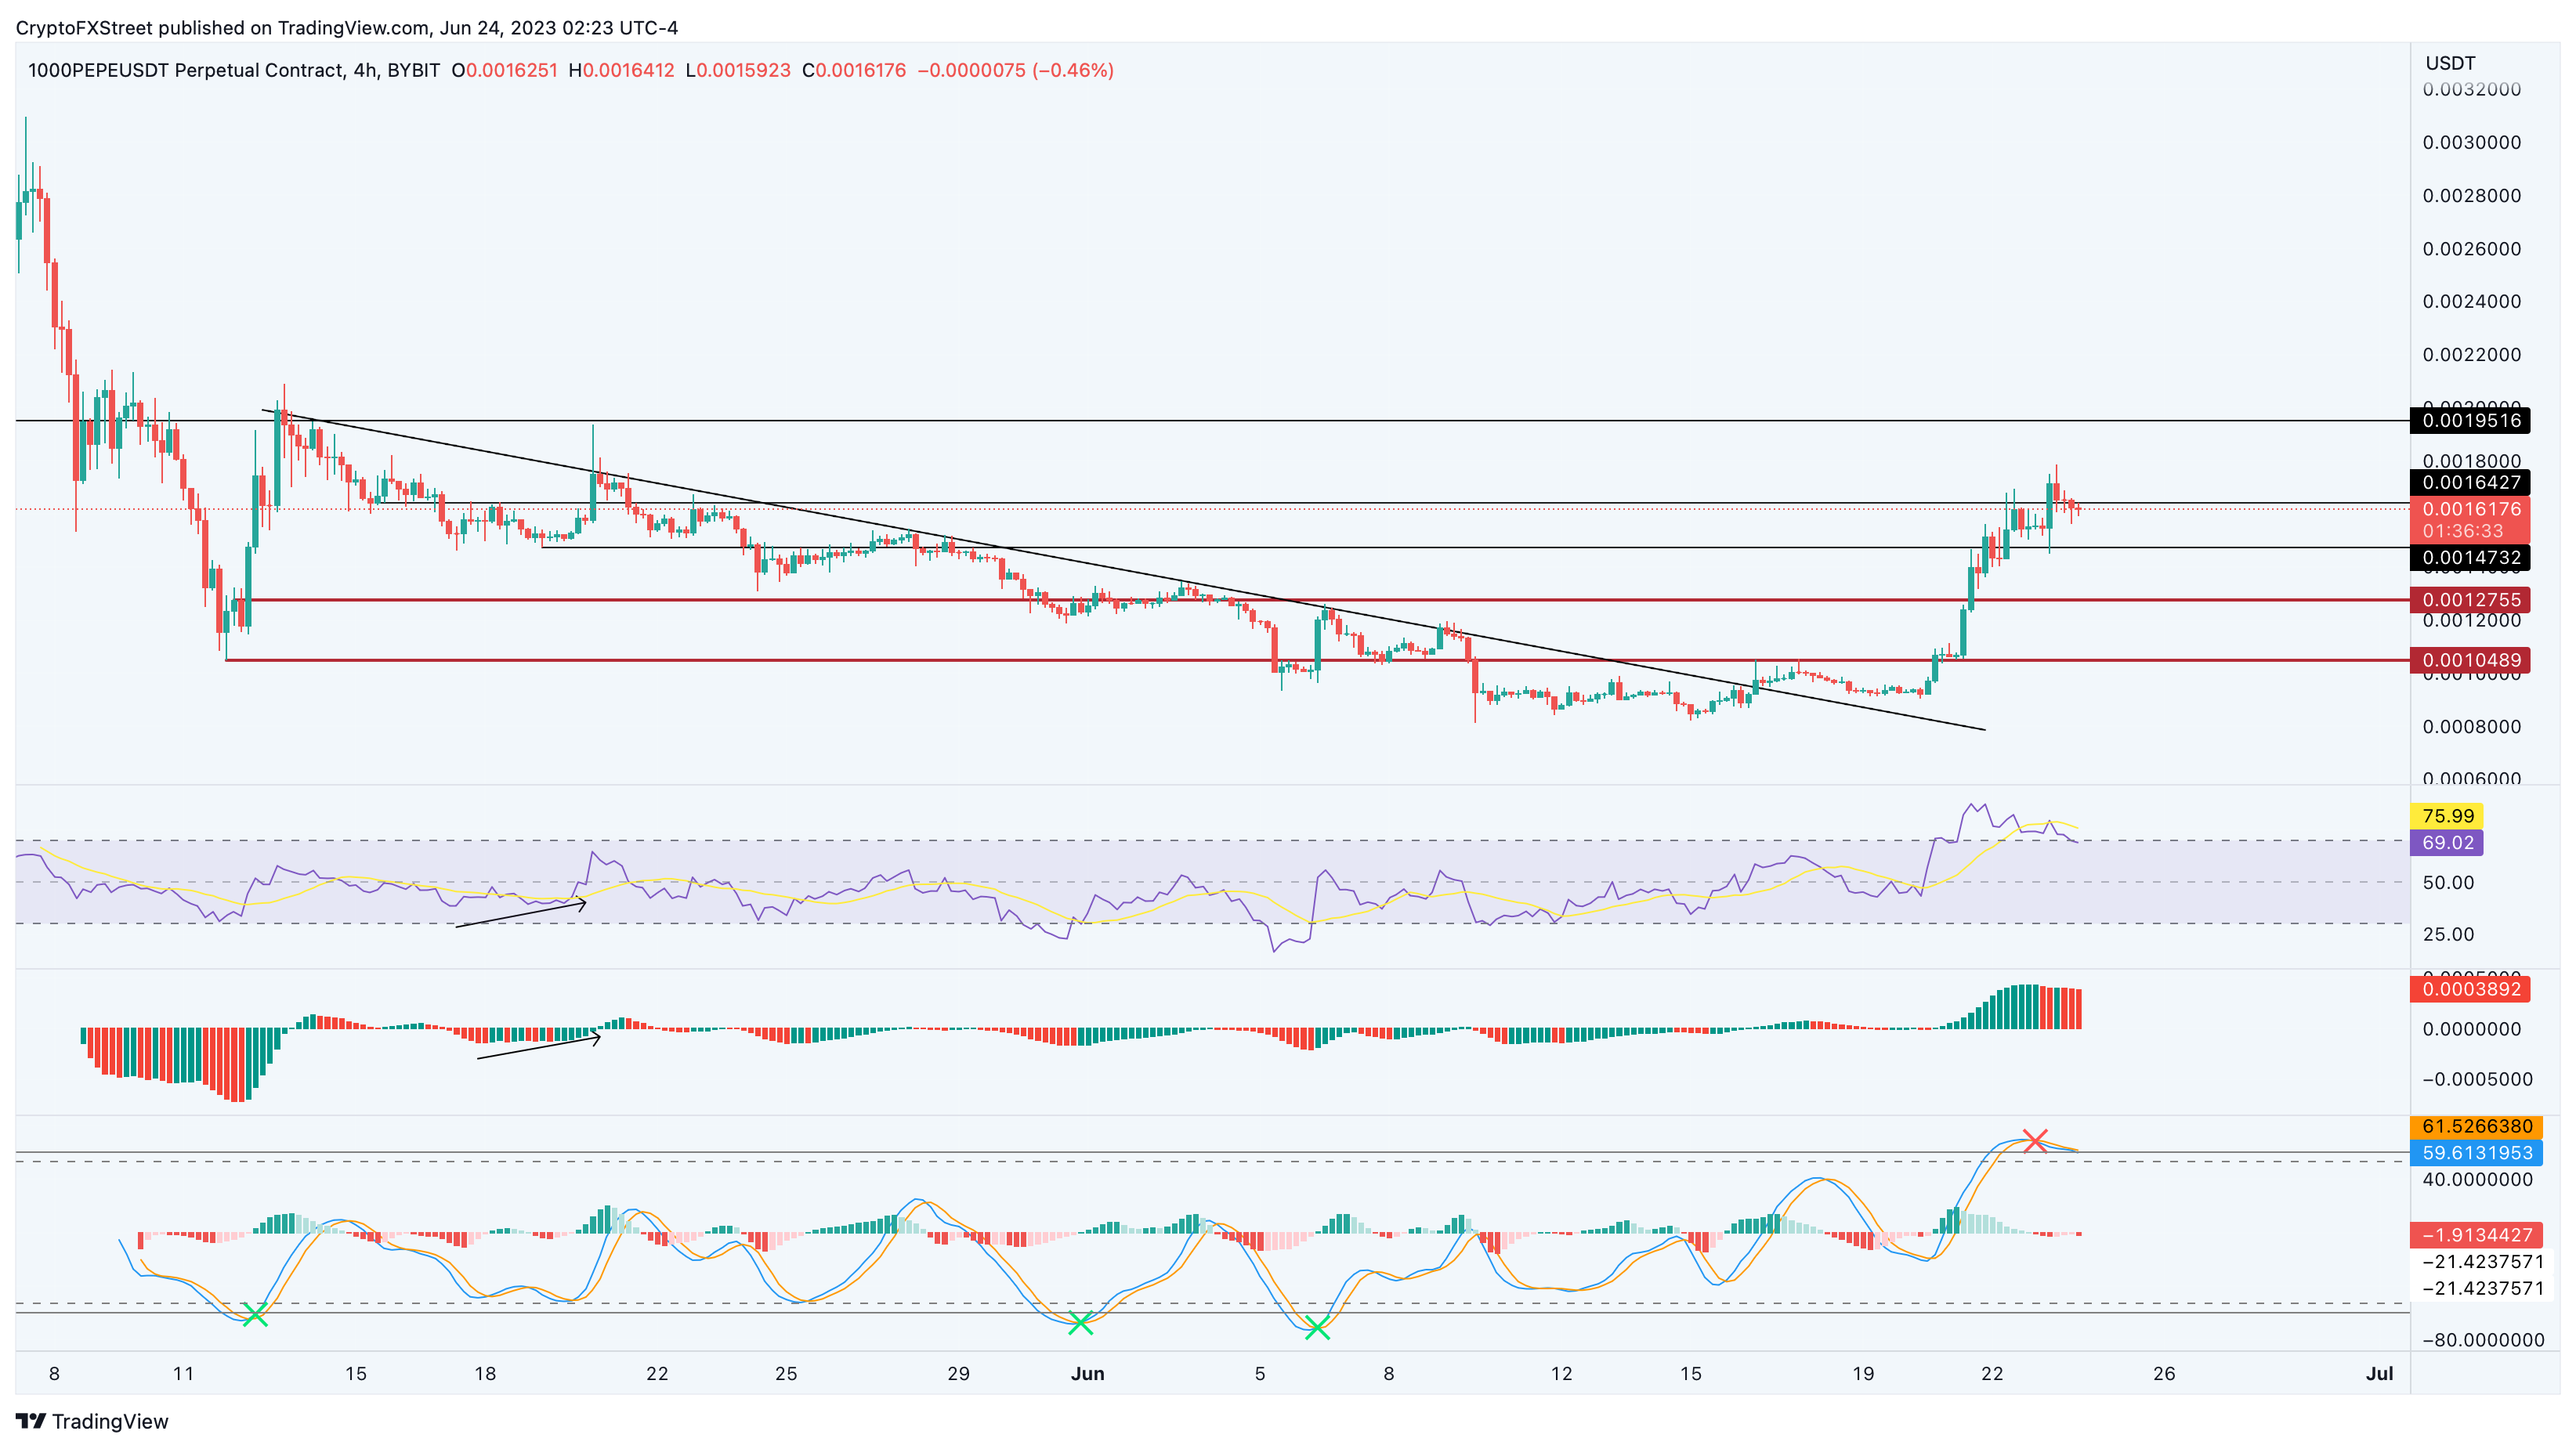
The $0.00000147 and $0.00000127 support levels are likely going be tagged after retracing roughly 10% and 20% from the current position of $0.00000162. 
PEPE/USDT 4-hour chart

PEPE/USDT 4-hour chart

On the other hand, if PEPE price flips the $0.00000164 hurdle into a support floor while the momentum indicators mentioned above reset, it will invalidate the bearish outlook. In such a case, PEPE price could eye to retest the $0.00000195 resistance level. 

Author

Akash Girimath

Akash Girimath is a Mechanical Engineer interested in the chaos of the financial markets. Trying to make sense of this convoluted yet fascinating space, he switched his engineering job to become a crypto reporter and analyst.


More from Akash Girimath
Share:

Editor's Picks

Top 3 Price Predictions: BTC, ETH and XRP rebound as major support levels cap recent sell-off

Bitcoin, Ethereum and Ripple rebound modestly on Friday after correcting and testing their key support zone the previous day. BTC holds the 50-day Exponential Moving Average, ETH finds support around the 100-day EMA, while XRP holds the horizontal floor near $1.300.

Why Hyperliquid is losing RWA market share to centralized exchanges

Hyperliquid (HYPE) is losing market share in real-world asset perpetual futures to centralized exchanges even as the overall financial market faces pressure. Hyperliquid’s trade.xyz accounted for roughly 80% of RWA perpetual trading volume in July, according to Artemis data shared by Ark Invest Digital Asset Head of Research Lorenzo Valente..

Cardano Price Forecast: Whale selling deepens ADA correction

Cardanoedges higher by nearly 2% on Friday, following a roughly 6% decline the previous day. The pullback aligns with the sell-side appeal among large-wallet investors, commonly referred to as whales, and Cardano derivatives. The technical outlook for ADA is bearish, with downside momentum persisting. Whales are losing their appetite for holding ADA tokens, fueling near-term selling pressure.

Bitcoin falls 4% as chip stocks plunge 6.7% and oil surges
Bitcoin (BTC) fell below $82,000 on Thursday as the crypto market joined a broader market sell-off driven by concerns over artificial intelligence (AI) spending, rising oil prices and escalating geopolitical tensions involving the US and Iran. The top crypto fell 4% to $81,130 as macro fears weighed on prices across the digital asset market.
Bitcoin: Macroeconomic headwinds, cooling demand cap BTC gains
Bitcoin (BTC) extends losses this week, trading below $82,500 as of Friday as selling pressure continues. Weakening institutional demand supports this pullback as BTC spot Exchange-Traded Funds (ETFs) are on track to record a two-week withdrawal streak, reaching $146.19 million in net outflows through Thursday.