OMG Network price must slice through this critical barrier for an upswing to record highs
- A correction will come into the picture if a double-top pattern on the OMG Network daily chart is confirmed.
- A slump in OMG's network growth is a bearish signal and could derail the upswing.
- The IOMAP suggests that the least resistance path is upwards as robust support areas sit in place.

OMG Network is performing exceptionally well in price action. The uptrend from the dip in December remained consistent, especially in January. The first week of February has also yielded massive gains for OMG. However, there is a chance that the recovery to all-time highs will stall due to a critical resistance level.
OMG Network uptrend is an uphill challenge
After growing consistently in the first month of the year, OMG seems to have slowed down due to the possibility of a double-top pattern on the daily chart. The pattern is characterized by a couple of high points and identifies an impending bearish reversal signal.
Momentum tends to lag as the price nears the second peak. Note that a brief breakout may occur, but it becomes unsustainable, leading to a freefall. It is vital to wait for a confirmed correction to avoid falling for a false double-top pattern.
At the time of writing, OMG is trading at $4.8, while buyers fight the immediate resistance at $5 (double-top). A correction from this zone is likely to trigger losses as far as $2.4. However, the 50 Simple Moving Average, the 100 SMA and the 200 SMA will absorb the selling pressure above $3.2 and perhaps stop the breakdown.
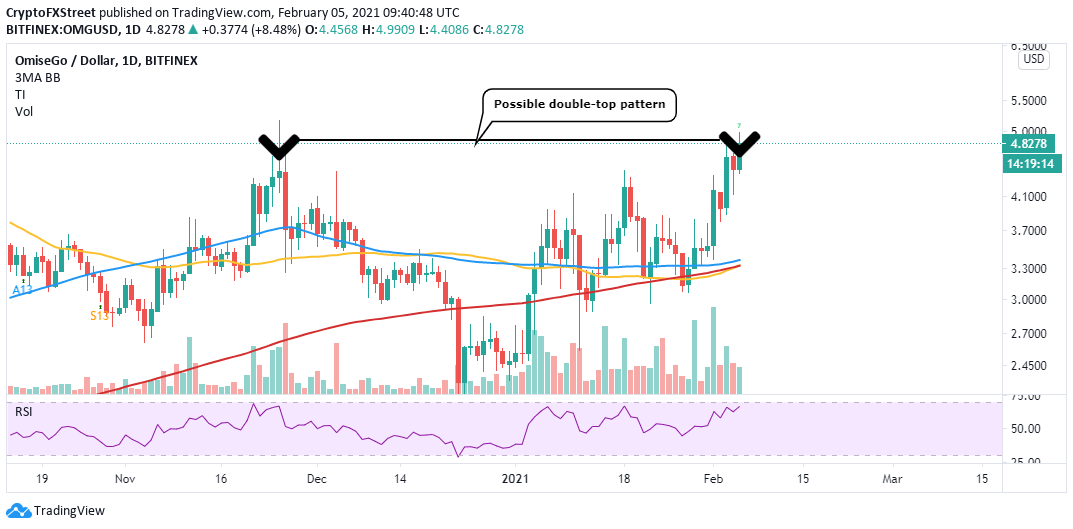
OMG/USD daily chart
The TD Sequential indicator recently presented sell signals on the 1-hour and 12-hour charts. These calls to sell manifested in green nine candlesticks. If validated, OMG Network could experience a surge overhead pressure, adding credence to the bearish picture.
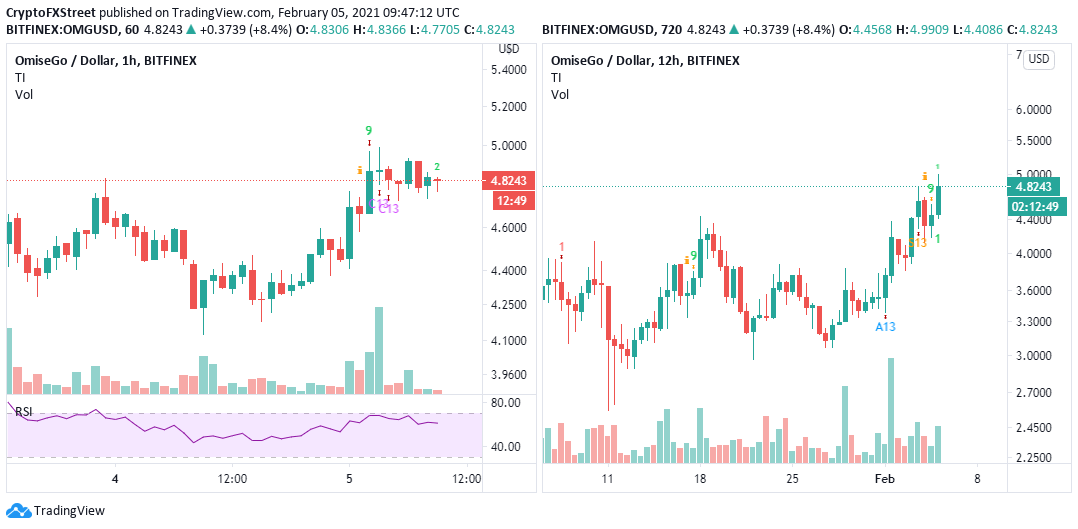
OMG/USD 1-hour/12-hour chart
Santiment’s network growth metric recently topped out at 1,662, the highest in 2021. The on-chain tool tracks the number of new addresses joining the network daily. An increase in network growth is usually a bullish signal for the crypto.
However, a slump in the number of newly created addresses as seen on the chart and proposes that a price drop will follow. Similarly, the project’s mainstream adoption suffers when network growth is declining.
%20[12.55.48,%2005%20Feb,%202021]-637481171138999944.png)
OMG network growth
Looking at the other side of the fence
IntoTheBlock shines a light on what lies ahead of OMG Network. For now, the IOMAP model reveals that the token has a smooth path above $5 and could extend the bullish leg past $6.
OMG’s all-time high sits at $9.5 and would be achieved if the price first settles above $5 (ignoring the double-top pattern). Immense buy orders would be triggered as investors speculate price action towards the record highs.
-637481170956804287.png)
OMG Network IOMAP chart
On the other hand, strong support has been established between $4.4 and $4.5. Here, 975 addresses are currently profiting from the nearly 13.4 million OMG bought in the range. It is doubtful that these investors are willing to let bears easily slice through this support, thus ensuring that the focus remains on rising to the levels toward $9.5.
Author

John Isige
FXStreet
John Isige is a seasoned cryptocurrency journalist and markets analyst committed to delivering high-quality, actionable insights tailored to traders, investors, and crypto enthusiasts. He enjoys deep dives into emerging Web3 tren


