Neo price analysis: NEO/USD breaks above the triangle formation
- NEO/USD in on the course of having a hattrick of bullish days.
- The market momentum has shifted from bearish to bullish as per the MACD indicator.

NEO/USD daily chart
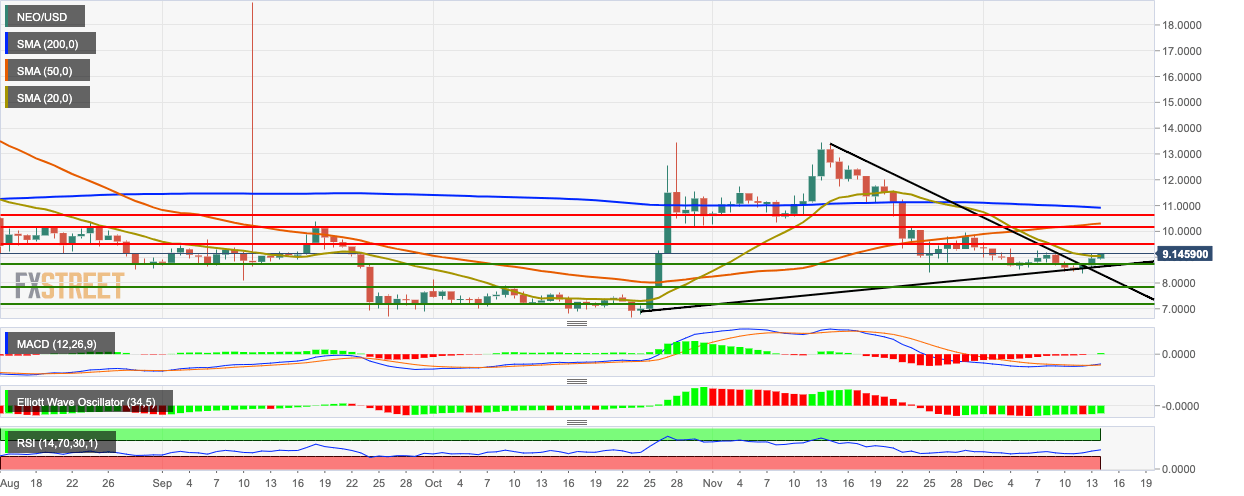
NEO/USD went up from $8.95 to $9.15 in the early hours of Saturday and is on the course of charting a hattrick of bullish days. During this time, NEO/USD went up from $8.56 to $9.15, breaking above the triangle pattern. The market is still floating below the 200-day Simple Moving Average (SMA 200), SMA 50 and SMA 20 curves. The market momentum has shifted from bearish to bullish as per the Moving Average Convergence/Divergence (MACD) indicator. The Elliott Oscillator has had seven green sessions out of the last eight, while the Relative Strength Index (RSI) indicator is trending around 51.25.
Author

Rajarshi Mitra
Independent Analyst
Rajarshi entered the blockchain space in 2016. He is a blockchain researcher who has worked for Blockgeeks and has done research work for several ICOs. He gets regularly invited to give talks on the blockchain technology and cryptocurrencies.


