MATIC attracts fresh capital as Polygon investors dream of new all-time highs
- Polygon price saw a bullish uptick this morning as buying volume increased massively.
- MATIC price action is lifted above the orange ascending trend line, rebooting the uptrend.
- With just two technical resistances in the way, new all-time highs could be in the making.

Polygon (MATIC) saw a significant upswing in buying volume this morning as bulls were able to push price-action back above the orange ascending trend line, which has acted as the backbone of a long-term uptrend. Given the Relative Strength Index(RSI) is still only at 50, bulls have plenty of room to push MATIC price even higher before it becomes overbought. An additional incentive for investors to sit on their hands and not book any profits preemptively is that this rally could hit new all-time highs at $2.90.
MATIC price could rise to record highs
MATIC price bounced off the $1.75 level that goes back to June 7 and has seen excellent resistance and support. The level acted as a launching platform on Tuesday and sees a continuation of that uptrend today in the European session. With that continuation, bulls were able to push MATIC price action back above the orange ascending trend line that acted as a backbone for the continuing uptrend.
As the bull trend further unfolds, expect to see some profit-taking along the way with the R1 resistance level at $2.15 and a historical resistance level at $2.48, together with the R2 resistance and the R1 from the previous month. The last level will be an important one where there is an increased risk that MATIC price action will start to fade under some profit-taking pressure. As long as investors can keep sitting on their hands, expect a further push, hitting new all-time highs at $2.90 by the end of this week.
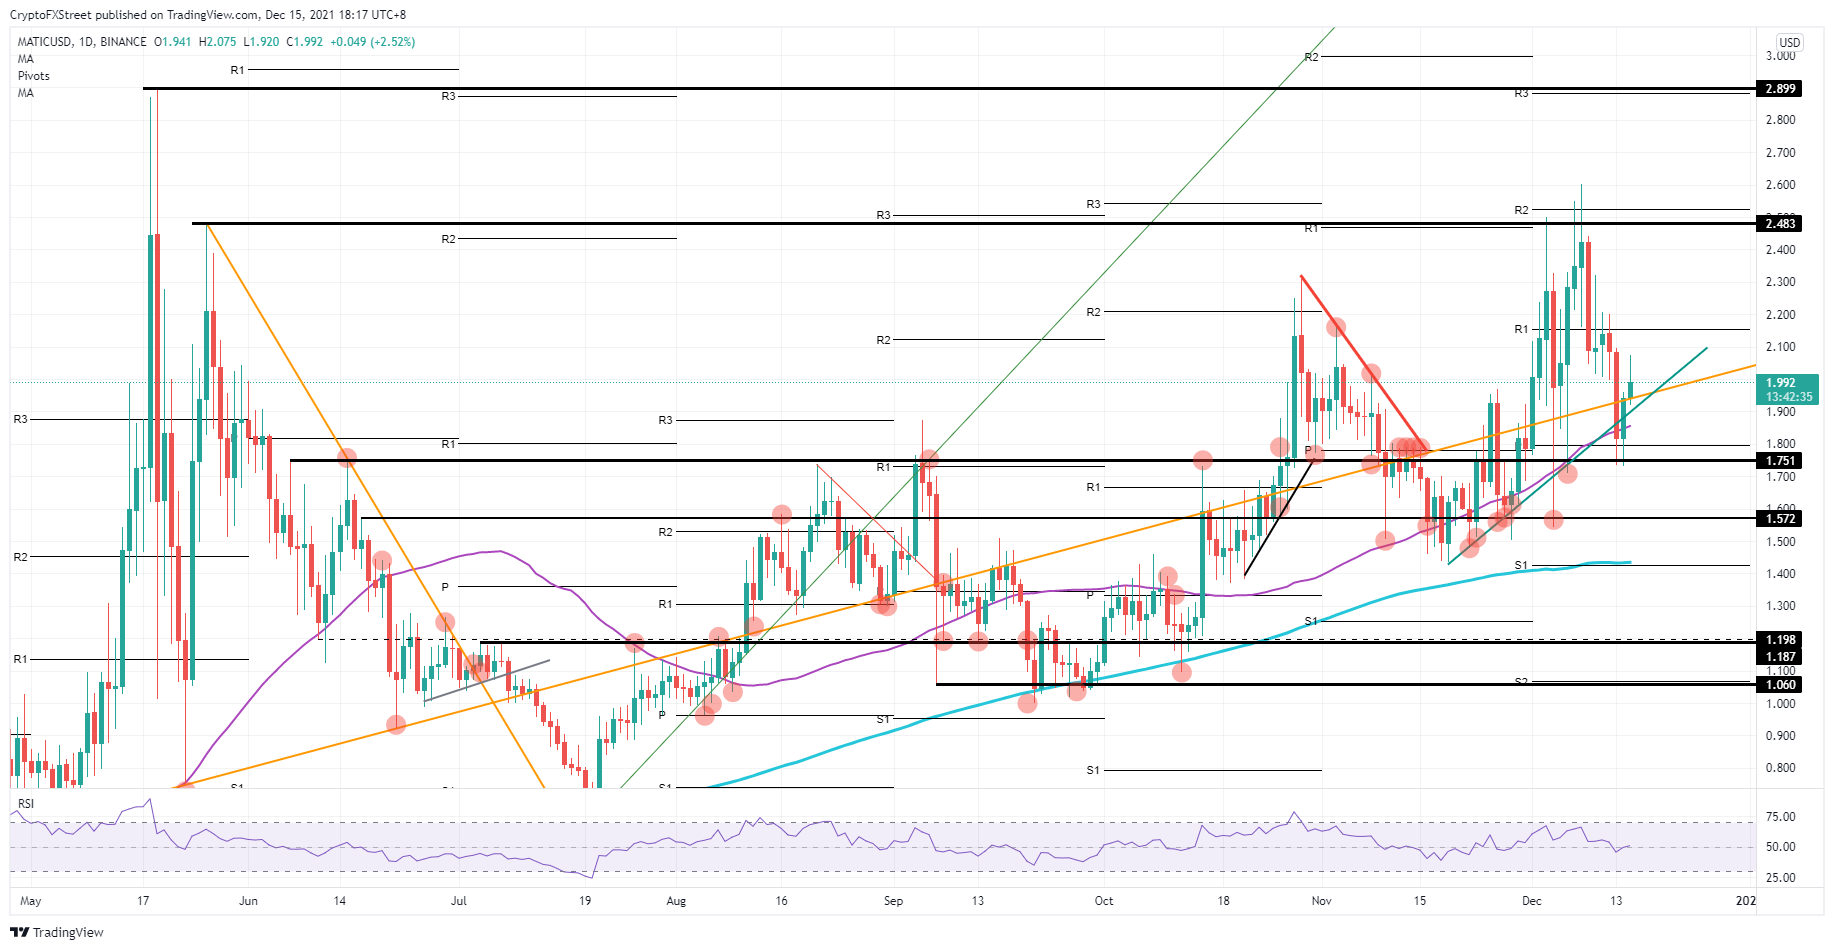
MATIC/USD daily chart
If a catalyst event would turn out to be a negative trigger, for example, the FED rate decision this evening, expect a pullback towards $1.75 and a downward spiral move towards $1.57. Depending on the central bank's hawkish tone, expect either for $1.57 to hold – like it did on December 4 – or for it to break and price to hit the monthly S1 support and 200-day Simple Moving Average at $1.43.
Author

Filip Lagaart
FXStreet
Filip Lagaart is a former sales/trader with over 15 years of financial markets expertise under its belt.


