- Polygon price hit a curb with a false breakout above the monthly R2 resistance level.
- MATIC sees its rally fade quite quickly due to lack of tailwinds.
- Expect a further leg lower in search of some support before rebooting the uptrend.
Polygon (MATIC) has been halted in its tracks after attempting to retake the monthly R2 resistance level at $2.50. As MATIC price fades quite sharply, bulls will want to wait for a solid entry-level before reengaging. In the meantime, bears have their hands free to run price action further down towards $1.80.
MATIC bulls are sidelined, awaiting the right time and entry to engage
MATIC price is fading strongly after bulls’ failed attempt to break above the monthly R2 resistance level near $2.50. The pull-back actually presents bulls with an excellent entry-level to rejoin the rally and reboot the trade, with the potential to hit new all-time highs. At the same time, the break below the R1 resistance level at $2.20, shows bears are further in control of MATIC price action, especially as market sentiment continues to pitch negative.
As such, a further 17% devaluation is a plausible outcome by the end of the week. This is further likely because bulls will want to wait for a proper entry-level near $1.80, together with the historical level at $1.75. These two elements should help contain any further sell-offs and should see a bullish uptick as the Relative Strength Index (RSI) will by then be trading around the 50-level. This should attract more investors and see a reboot of the uptrend towards new all-time highs at $2.90.
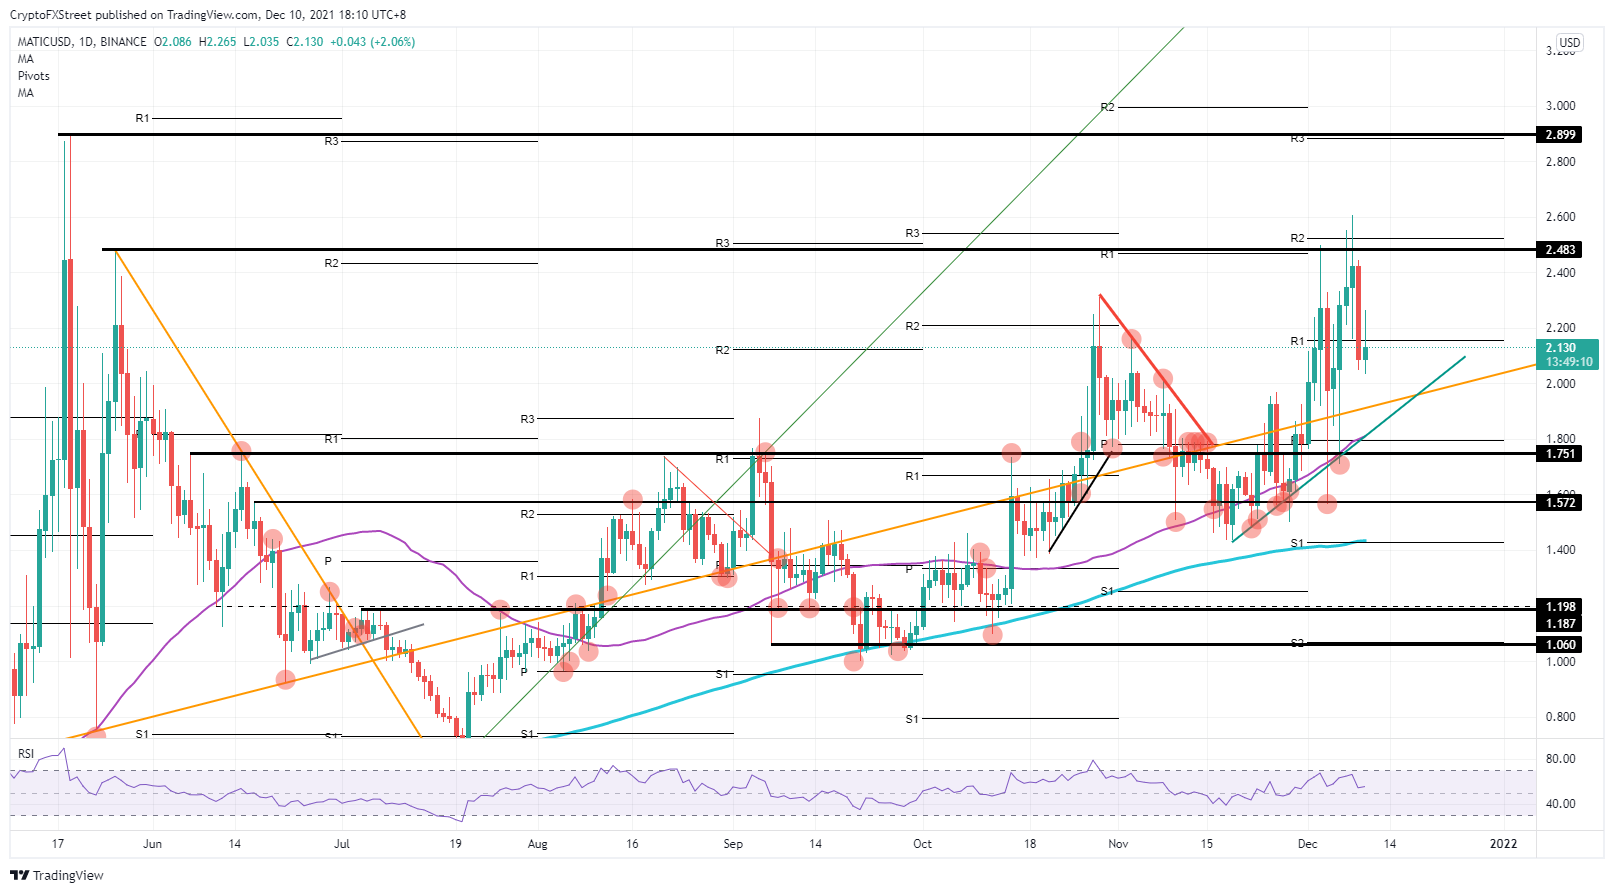
MATIC/USD daily chart
Should market sentiment turn positive, expect this to provide a catalyst for MATIC price to perform a U-turn and retest $2.50 quite quickly. At that level there may be some nervousness as previous attempts failed before, but with the RSI not yet in overbought, expect more room for investors to play the rally and target new all-time highs at $3.0.
Information on these pages contains forward-looking statements that involve risks and uncertainties. Markets and instruments profiled on this page are for informational purposes only and should not in any way come across as a recommendation to buy or sell in these assets. You should do your own thorough research before making any investment decisions. FXStreet does not in any way guarantee that this information is free from mistakes, errors, or material misstatements. It also does not guarantee that this information is of a timely nature. Investing in Open Markets involves a great deal of risk, including the loss of all or a portion of your investment, as well as emotional distress. All risks, losses and costs associated with investing, including total loss of principal, are your responsibility. The views and opinions expressed in this article are those of the authors and do not necessarily reflect the official policy or position of FXStreet nor its advertisers. The author will not be held responsible for information that is found at the end of links posted on this page.
If not otherwise explicitly mentioned in the body of the article, at the time of writing, the author has no position in any stock mentioned in this article and no business relationship with any company mentioned. The author has not received compensation for writing this article, other than from FXStreet.
FXStreet and the author do not provide personalized recommendations. The author makes no representations as to the accuracy, completeness, or suitability of this information. FXStreet and the author will not be liable for any errors, omissions or any losses, injuries or damages arising from this information and its display or use. Errors and omissions excepted.
The author and FXStreet are not registered investment advisors and nothing in this article is intended to be investment advice.
Recommended Content
Editors’ Picks
Sui bulls eyes for a new all-time high of $6.35
Sui price recovers most of its weekly losses and trades around $5.06 at the time of writing on Friday. On-chain metrics hint at a rally ahead as SUI’s long-to-short ratio reaches the highest level in over a month, and open interest is also rising.
Bitcoin Weekly Forecast: Room for a recovery or continuation of the pullback?
Bitcoin’s price slightly recovers and trades around $94,700 on Friday after declining nearly 6% earlier this week. US Bitcoin spot Exchange Traded Funds data shows signs of mild recovery, with a total net inflow of $462.2 million until Thursday.
Top 3 Price Prediction Bitcoin, Ethereum, Ripple: All hints for a continuation of the correction
Bitcoin retests its key support level of $92,493; a firm close below it could continue its ongoing correction. Ethereum price closed below its crucial support level of $3,236, suggesting the continuation of the pullback.
XRP funding rates flashes negative, eyes $2.17 following 4% decline
Ripple's XRP declined 4% on Friday following a decline in its funding rates. The remittance-based token could decline to test the $2.17 support level if the crypto market decline extends.
Bitcoin: Room for a recovery or continuation of the pullback?
Bitcoin’s (BTC) price slightly recovers and trades around $94,700 on Friday after declining nearly 6% earlier this week. US Bitcoin spot Exchange Traded Funds (ETF) data shows signs of mild recovery, with a total net inflow of $462.2 million until Thursday. A 10xResearch report released this week projects Bitcoin’s price action for the upcoming major events in January.
Best Forex Brokers with Low Spreads
VERIFIED Low spreads are crucial for reducing trading costs. Explore top Forex brokers offering competitive spreads and high leverage. Compare options for EUR/USD, GBP/USD, USD/JPY, and Gold.