MATIC price to present a buy opportunity before Polygon rallies
- Polygon price action is still stuck in an upward trend channel.
- MATIC’s current level looks a good buy near the lower end of the channel.
- Expect a return to the middle of the channel or swing to the upper band once global markets turn green again.

Polygon (MATIC) is still respecting the trend channel defined since July 2021 even after four consecutive days of losses. As MATIC price nears the lower range band, an excellent buy-entry presents itself to be part of the market before it swings back towards $2.50. With that move, a breakout above the upper trend line could be in the making with $2.90 as a target, as seen on December 26.
MATIC bulls stand ready to engage as momentum builds for a return to $2.90
Polygon price continues respecting the uptrend channel with some false breakouts above the upper band. With price action slipping further lower but still contained, bulls will want to start building up a stake in MATIC coins as a swing to the upside could be just around the corner. A break above the monthly pivot around $2.40 could see a test of $2.48.
At that point MATIC price could be set for either another fade or a break higher, from where things could become interesting. A daily close above $2.48 would open the door for an attack on $2.90, and the monthly R1 resistance level at $3.20 – it would also mean the $3.00 level would finally be broken firmly to the upside. From there, a repetition of the same pattern that occurred at the previous highs will probably replay itself, with yet a return to the lower boundary of the trend channel.
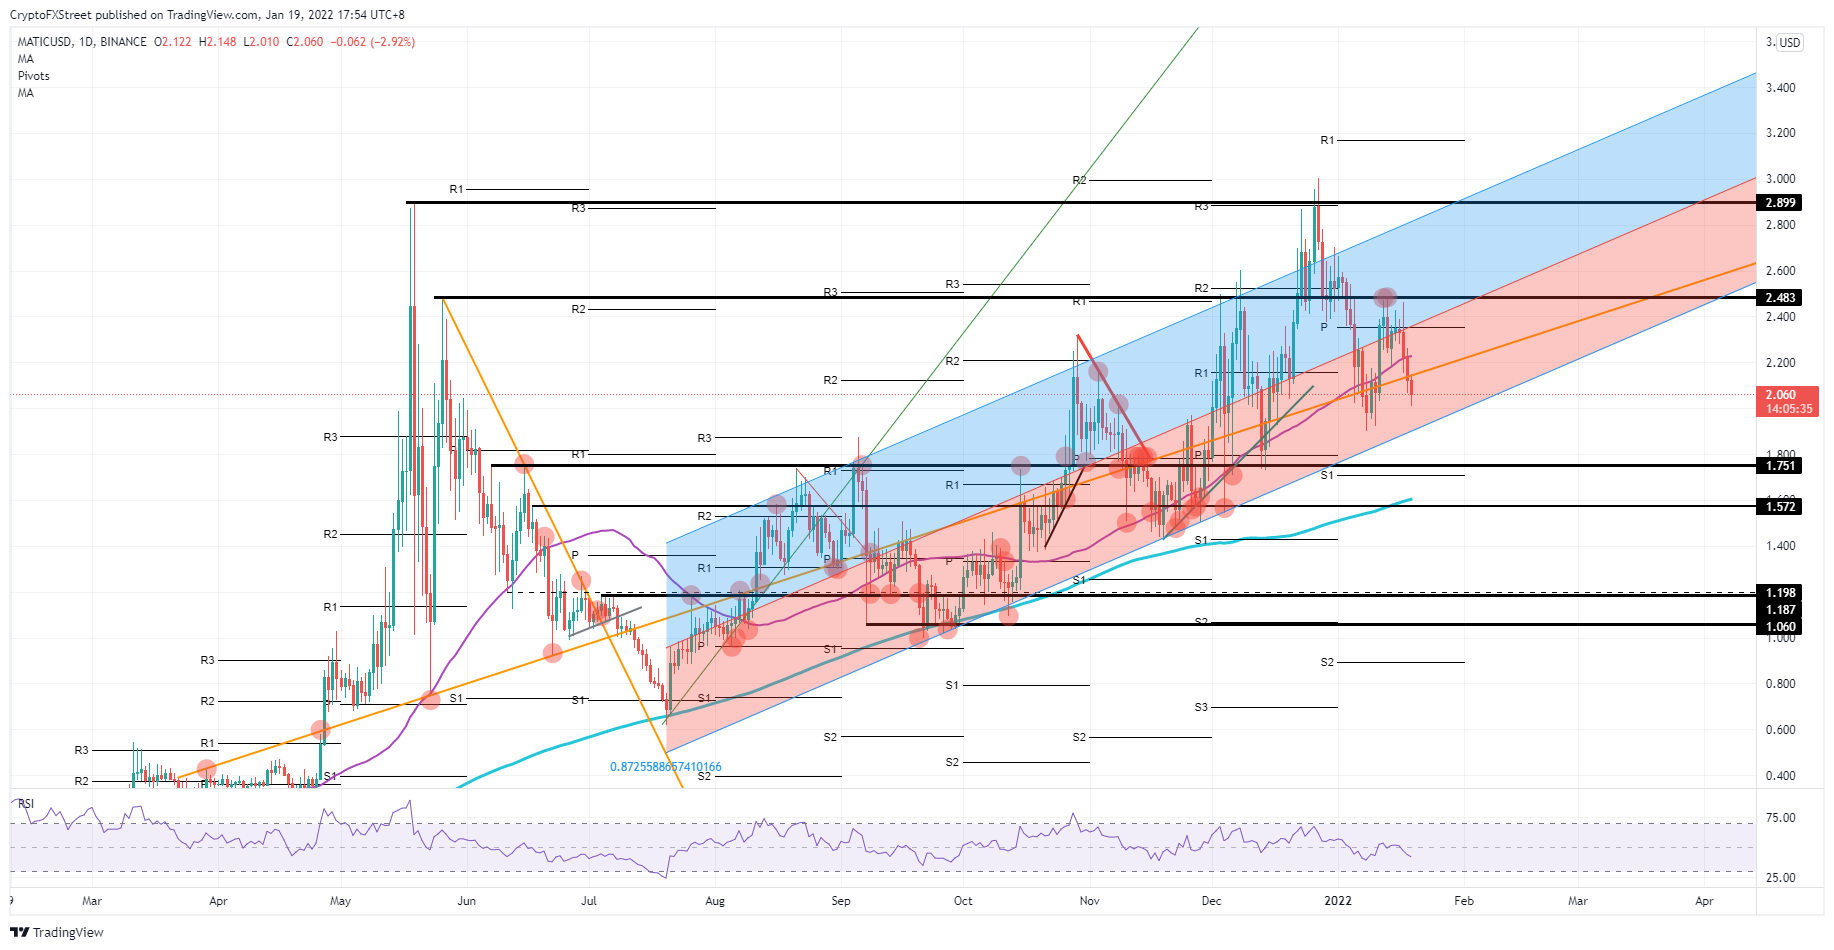
MATIC/USD daily chart
Downside risk for MATIC could be sparked by a rejection at $2.48, as seen on January 12. Investors would start to lose faith, leading to an accelerated correction towards the lower end of the channel and break below it towards $1.75, the first line in the sand as a defence. Below $1.75, there is the monthly S1 support, the 200-day Simple Moving Average, and $1.57 as technical support levels which may keep price from falling any further.
Author

Filip Lagaart
FXStreet
Filip Lagaart is a former sales/trader with over 15 years of financial markets expertise under its belt.




