Zcash Price Prediction: ZEC falls as demand stagnates, retail sentiment weakens
- Zcash is down over 2% on Wednesday, risking a bearish breakout of a symmetrical triangle pattern.
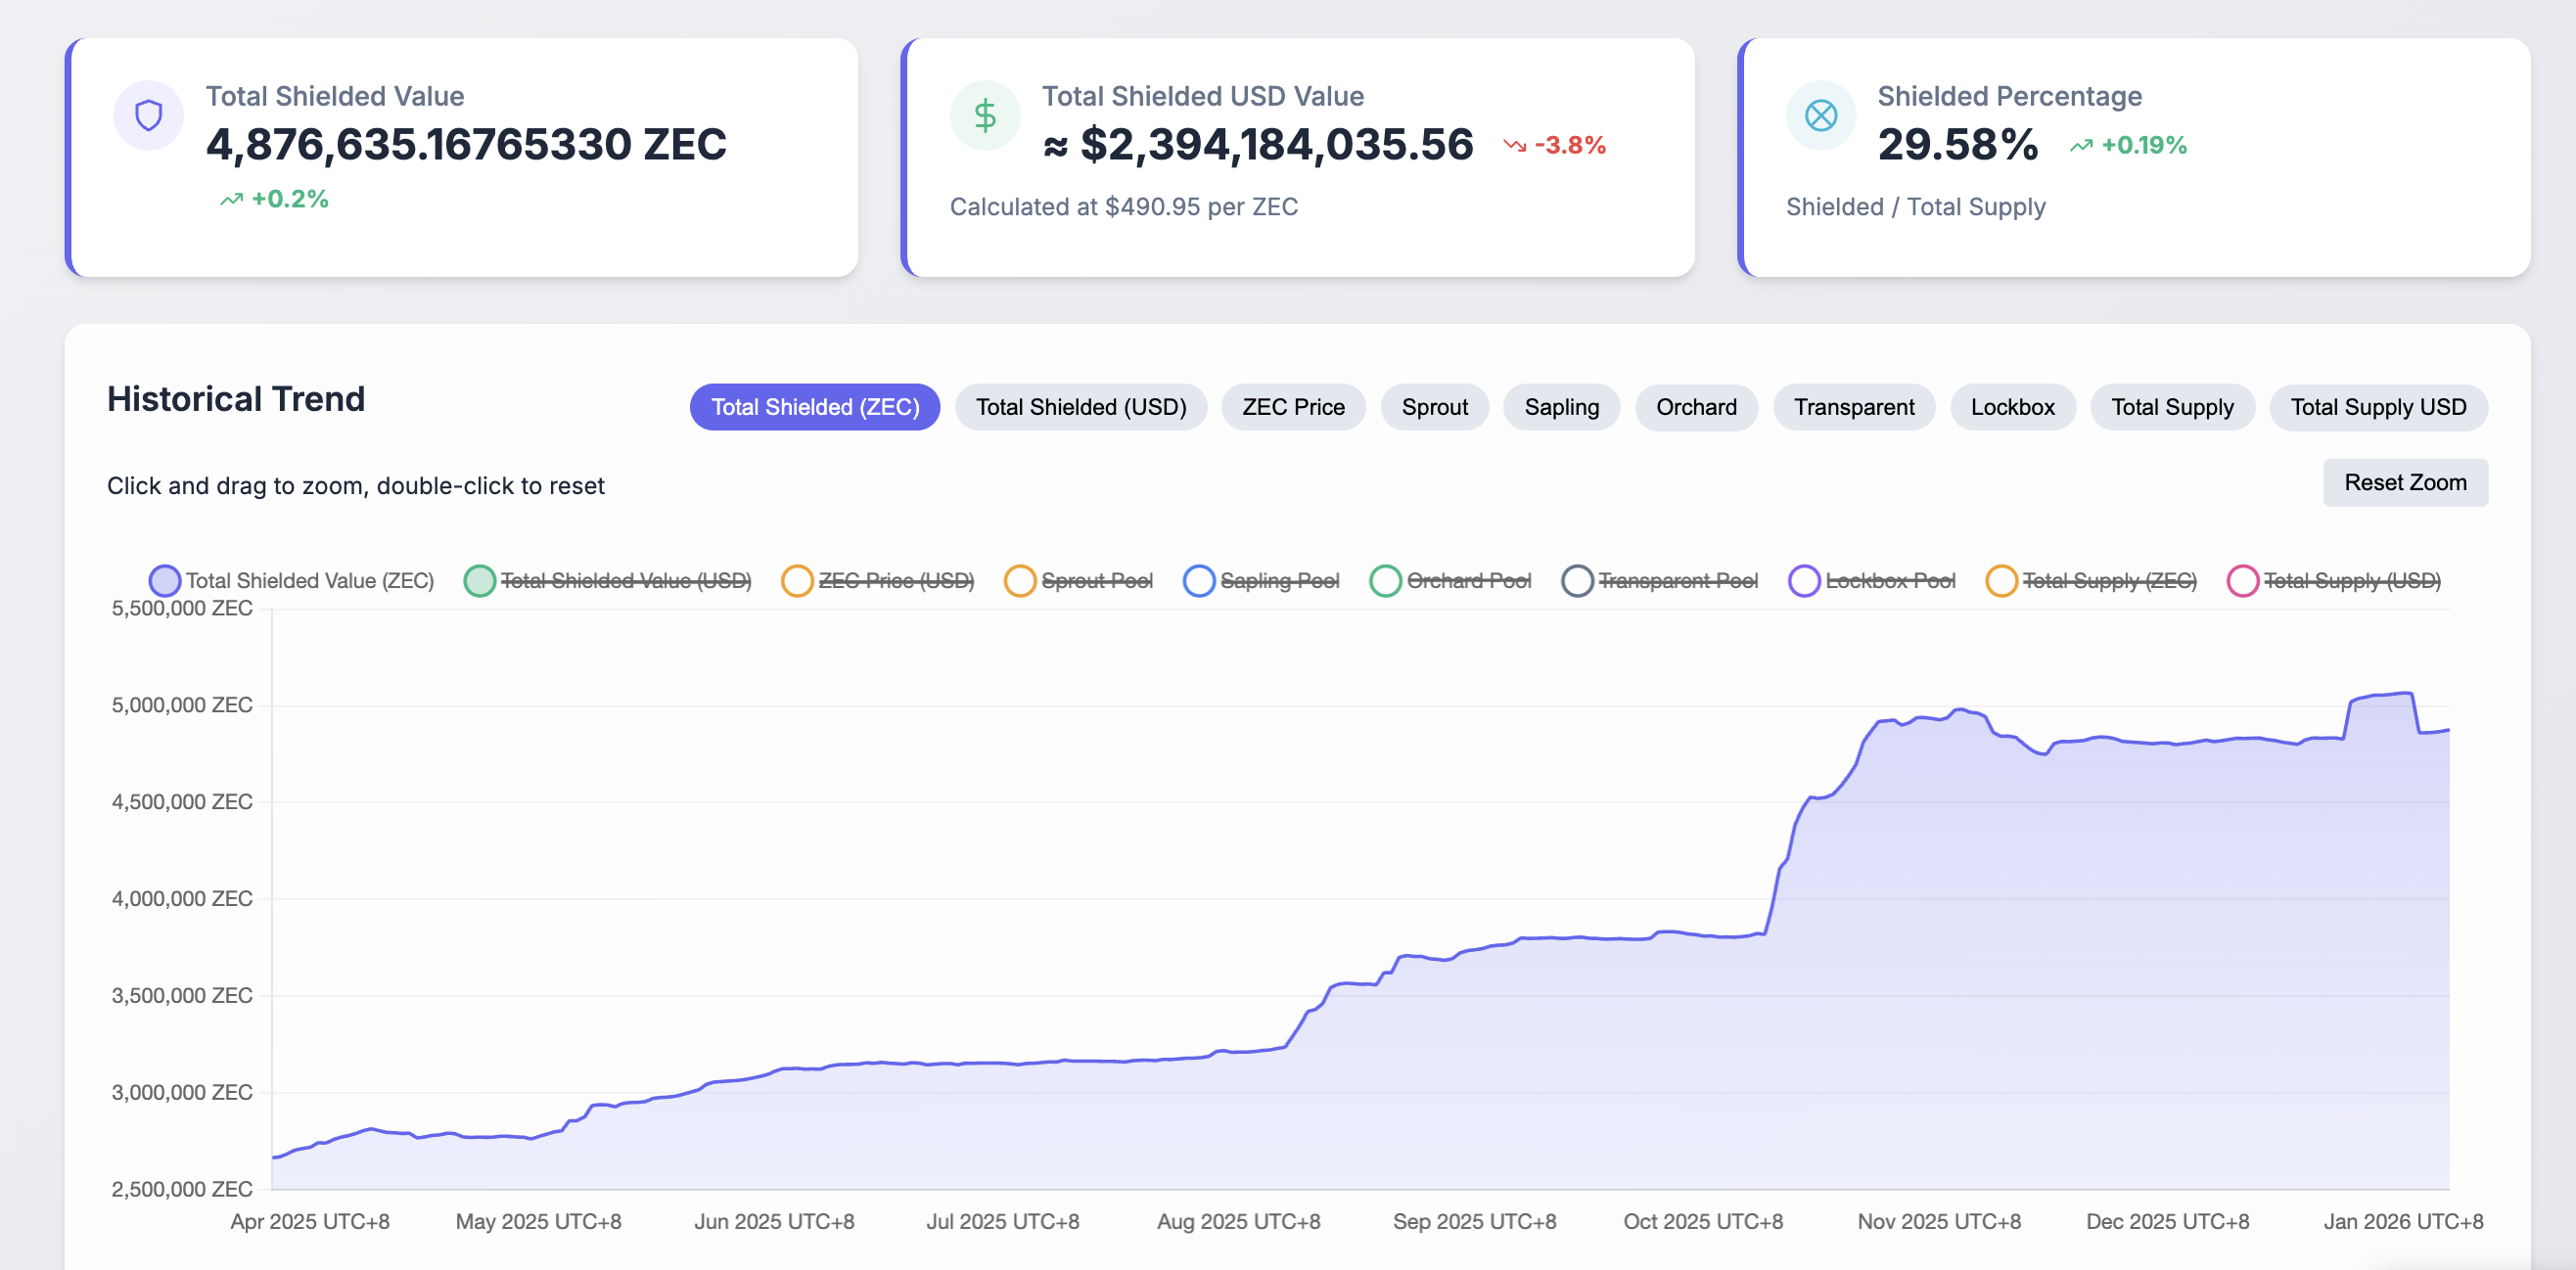
- Data shows stagnation in shielded ZEC pool, suggesting a lack of demand for the privacy coin.
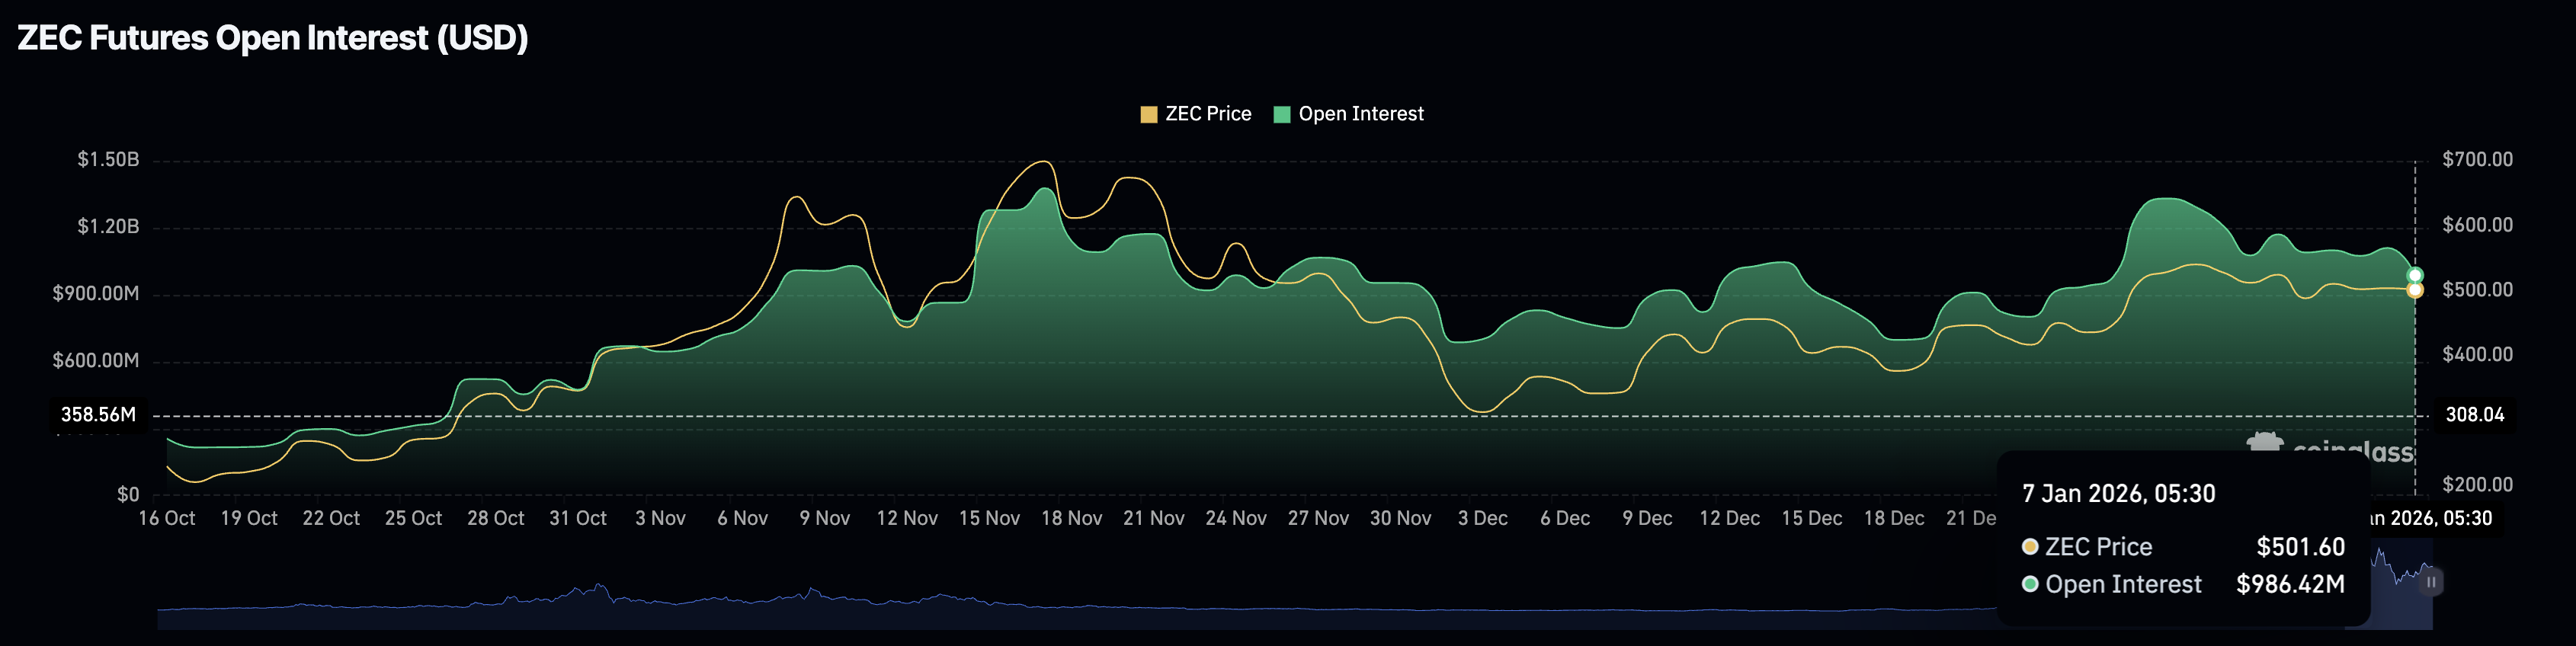
- Derivatives data shows a sell-side bias as ZEC futures Open Interest declines.

Zcash (ZEC) remains under selling pressure, extending its second bearish week and trading below $500 with over 2% decline at press time on Wednesday. The privacy coin experiences a consolidation in user demand as shielding pools consolidate. Meanwhile, retail sentiment shifts bearish in the derivatives market as short positions build up, aligning with declining ZEC futures Open Interest.
Zcash loses user demand, retail confidence
Zcash offers multiple pools that provide users with privacy by hiding transaction data through zero-knowledge proofs. However, the shielded pool, which holds roughly 4.87 million ZEC, or 29.58% of the total supply, has remained stagnant despite rising to over 5 million ZEC on January 1.
The lack of a steady inflow into the shielded pool suggests user demand is fluctuating, risking a correction in ZEC market value.
On the derivatives side, the privacy coin is losing retail confidence as CoinGlass data shows a rise in short positions while traders limit capital exposure. The ZEC futures Open Interest (OI) is at $986.42 million on Wednesday, down from $1.11 billion the previous day, suggesting traders are either withdrawing capital or reducing leverage to reduce exposure.
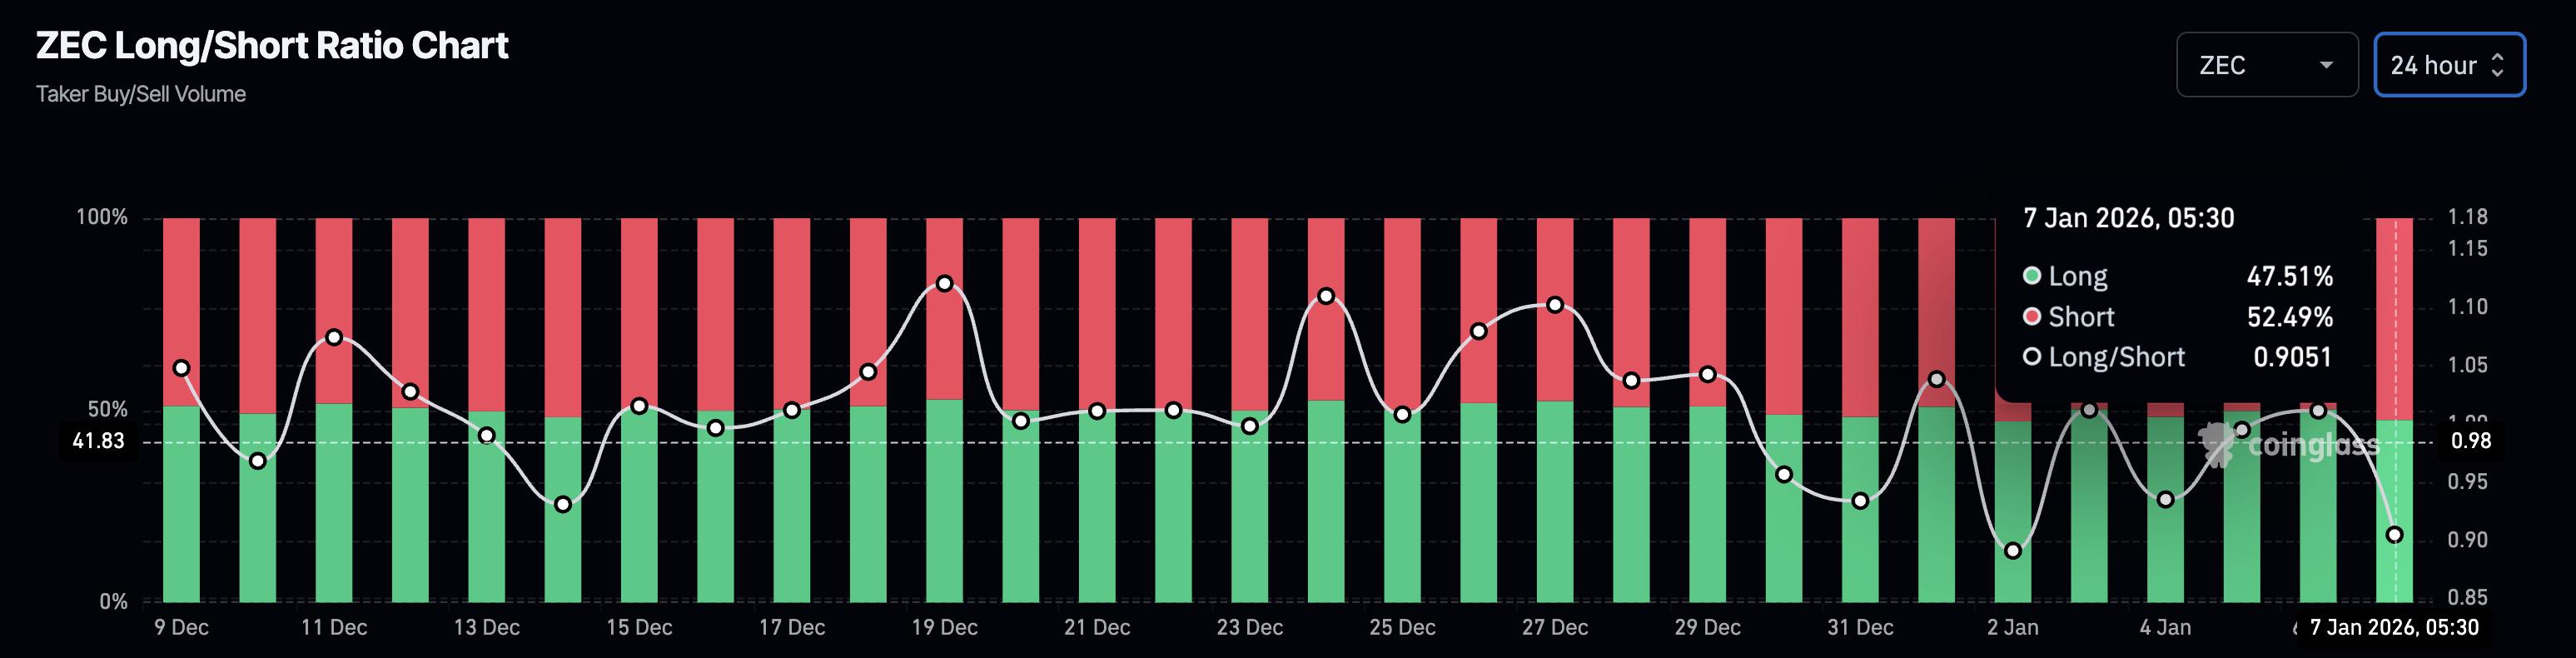
Additionally, the long-to-short ratio chart indicates that short positions have surged to 52.49%, from 49.71% on Tuesday, suggesting a sell-side dominance in fresh positions.
Zcash risks further loss below $500
Zcash risks breaking below a support trendline connecting the lows of December 3 and 18, which could confirm a bearish breakout of a symmetrical triangle pattern on the daily logarithmic chart. At the time of writing, ZEC is down over 2% on Wednesday, approaching the 50-day Exponential Moving Average (EMA) at $455.
If the privacy coin marks a daily close below $487, it would confirm the downside breakout, risking a steeper correction to $455. However, the potential decline could form a lower leg toward a trendline connecting the October 17 and December 3 lows, near $430.
The Relative Strength Index (RSI) is at 52 on the daily chart, declining towards the halfway line, suggesting a decline in buying pressure. Meanwhile, the Moving Average Convergence Divergence (MACD) indicator risks a crossover below the signal line, which would confirm a renewed bearish momentum.
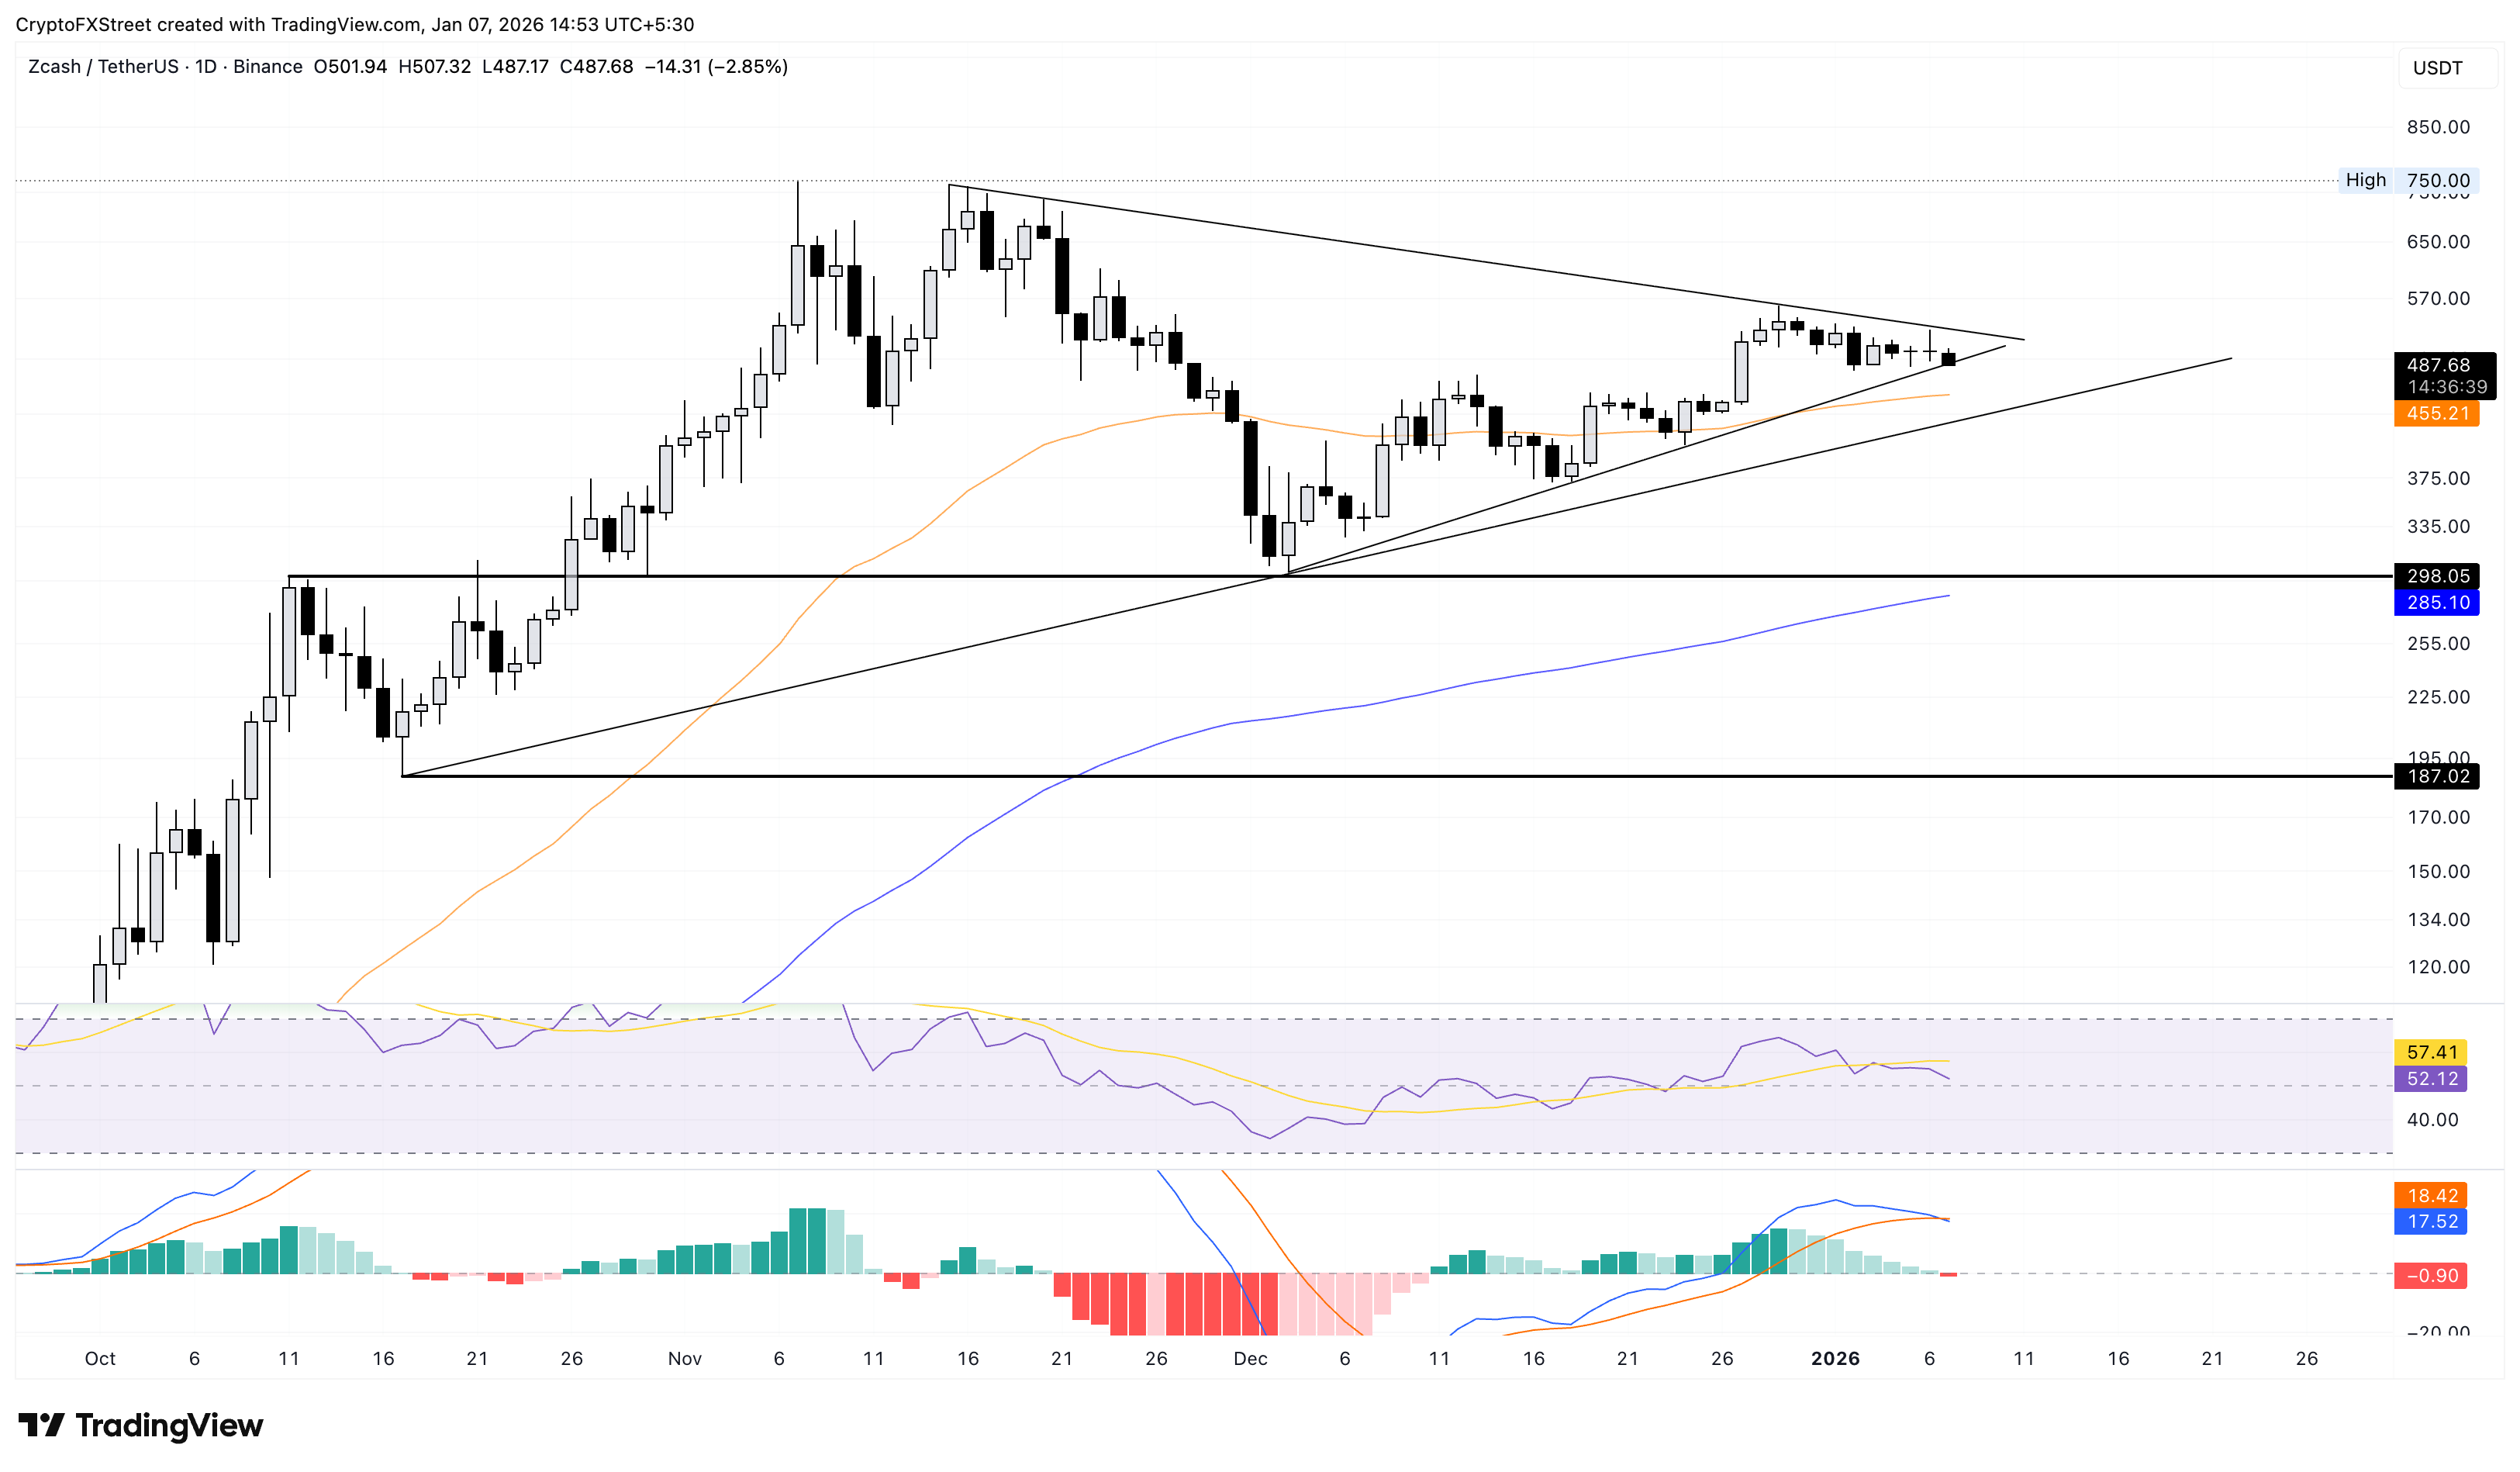
Looking up, if ZEC resurfaces above $500, it should exceed the overhead trendline connecting the November 15 and December 29 highs near $530, confirming a bullish breakout of the triangle pattern.
Author

Vishal Dixit
FXStreet
Vishal Dixit holds a B.Sc. in Chemistry from Wilson College but found his true calling in the world of crypto.



