MATIC Price Prediction: Polygon prepared to take the pole position
- MATIC price finding the June 22 low at $0.92 to be a formidable opponent to higher prices.
- The rising wedge pattern on the intra-day chart imposing a bearish alternative for short-term Polygon intentions.
- Impulsiveness died on July 22, with the four-day Rate of Change (ROC) at just 2%.

MATIC price climbed the cryptocurrency market leadership board on July 21 with a 29% gain. The bounce followed a test of the 200-day simple moving average (SMA) and an oversold reading on the daily Relative Strength Index (RSI). However, Polygon has not capitalized on the rebound, offering a 2% return over the last four days as it stumbles with the resistance inherent in the June 22 low of $0.92. Overall, a bullish MATIC outlook prevails, but the rising wedge on the intra-day chart projects some weakness.
MATIC price pulls back on the throttle, tarnishing the rebound
MATIC price exploded onto the scene again with a headlining gain of 29% on July 21, pushing it near the top of the cryptocurrency complex list of top performers. It was a compelling response to the -40% decline that had occurred since the breakdown from the symmetrical triangle pattern on July 12. Polygon is currently up 15.6% for the week but still carries a loss for the month of 21.6%.
Despite the double-digit monthly loss and the lack of impulsiveness following the July 21 gain of 29%, MATIC price is solidly positioned compared to other cryptocurrencies. It is well above the 50-week SMA and the 200-day SMA. Moreover, Polygon is not rattled by a bearish Death Cross pattern, a rapidly descending 50-day SMA or a hovering Ichimoku Cloud on the daily chart.
Based on the rising wedge pattern outlined on the four-hour chart, MATIC price may incur a minor correction, potentially down to the 50 four-hour SMA at $0.84. It is a U-turn for Polygon after it plotted a pennant pattern following the July 21 rebound. The pennant did resolve to the upside, but price traction was fleeting, leading to the current rising wedge.
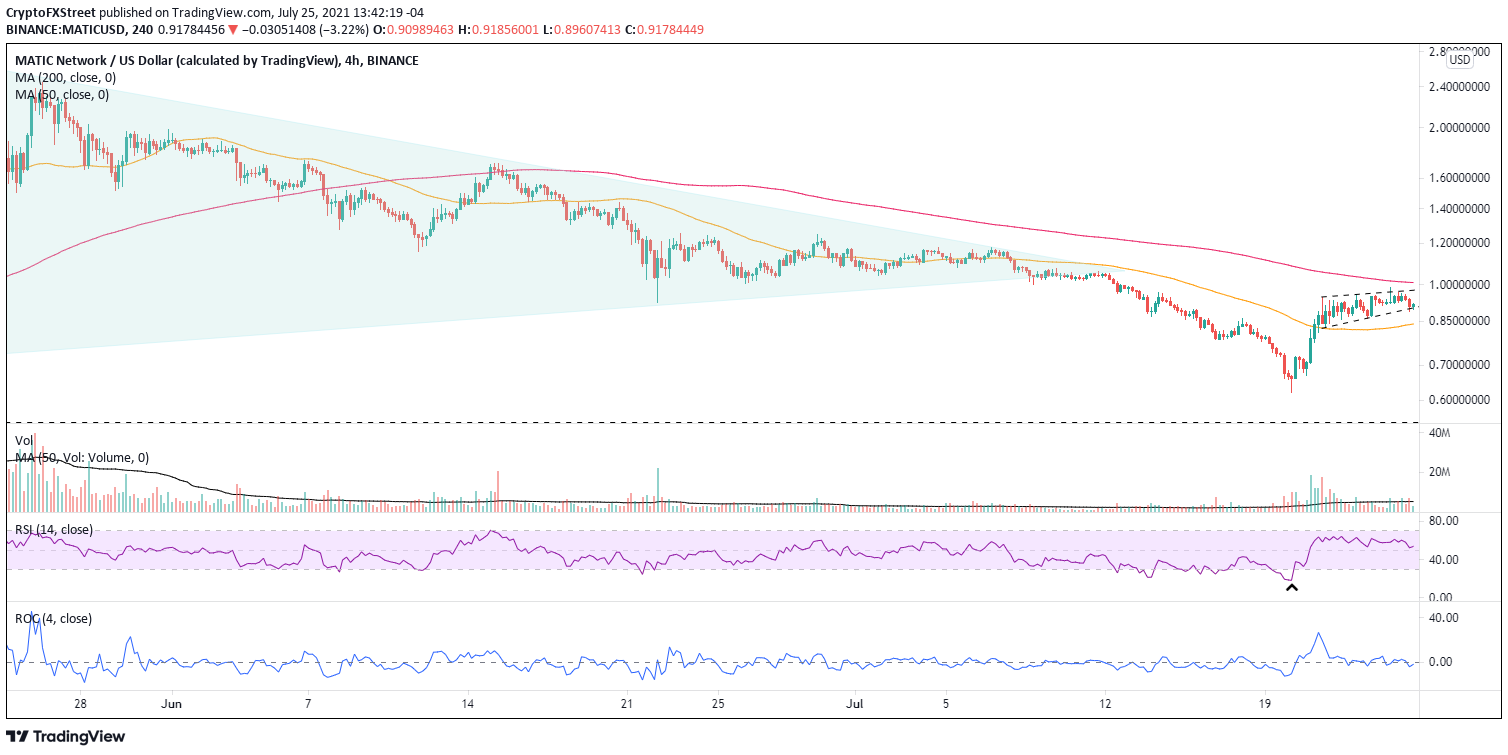
MATIC/USD 4-hour chart
With the four-hour chart flashing a rising wedge pattern and the inability of MATIC price to overcome the June 22 low of $0.92, Polygon will turn lower to release some of the price compression generated by the burst higher. Support will be engaged at the 50 four-hour SMA at $0.84, and a pullback should not exceed the May 23 low of $0.74. Each level could be bought with small position size.
A surge above the June 22 low will be met with resistance at the apex of the symmetrical triangle at $1.06 and then the 50-day SMA at $1.14. If the levels are busted, MATIC price will be unfettered to test the June 15 high of $1.75, logging a 90% gain from the current price.
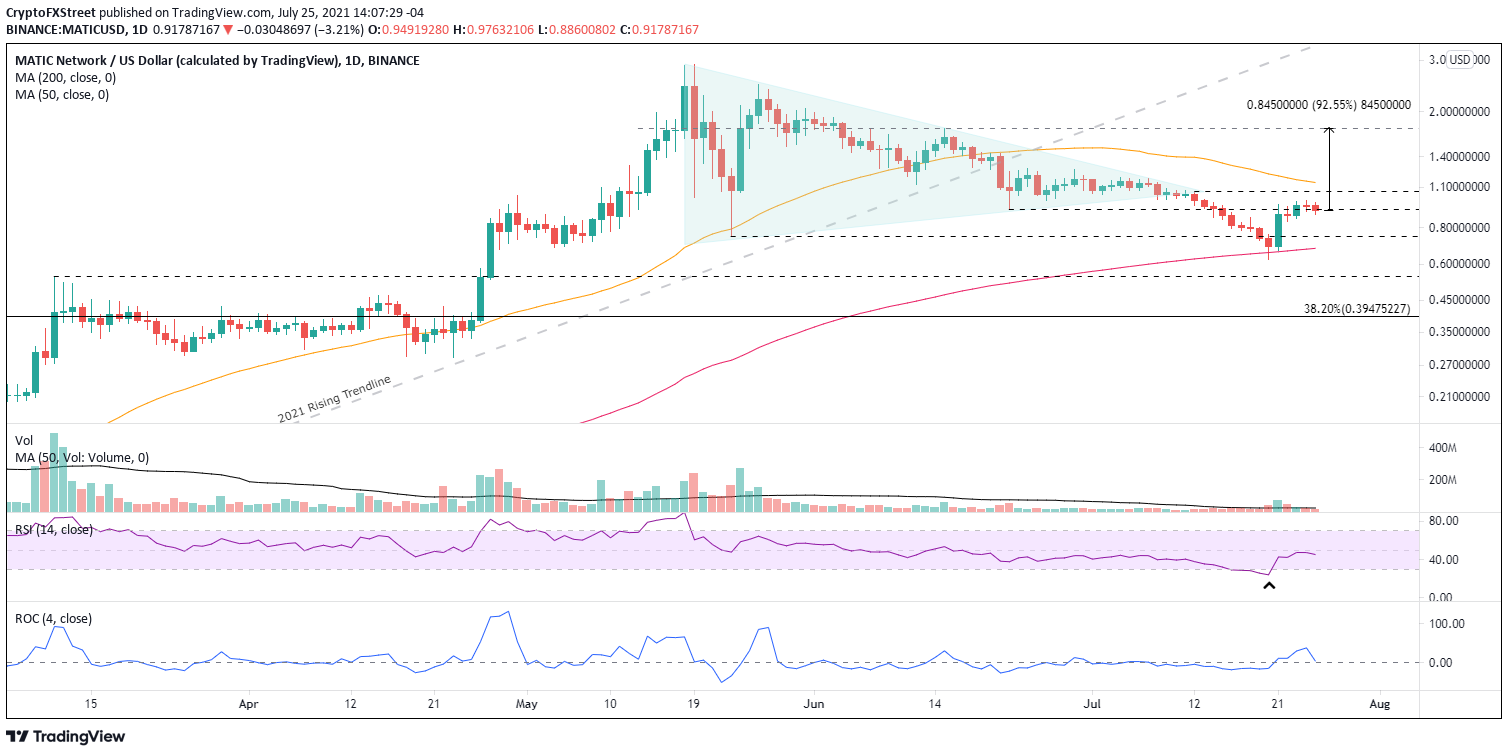
MATIC/USD daily chart
If a MATIC price pullback evolves into a heavy sell-off, the 200-day SMA is the critical support at $0.68. A close below the moving average opens the door to a test of the March 11 high of $0.54 and the 38.2% Fibonacci retracement of the 2021 advance at $0.39.
MATIC price has pulled back on the throttle, but it does not deflate the bullish outlook prescribed by the best daily gain since May 24 and the superior position of Polygon on the charts. Once the resistance levels are surmounted, the digital token is primed to retake the pole position in the cryptocurrency market.
Here, FXStreet's analysts evaluate where Polygon could be heading next as it seems bound for higher highs.
Author

Sheldon McIntyre, CMT
Independent Analyst
Sheldon has 24 years of investment experience holding various positions in companies based in the United States and Chile. His core competencies include BRIC and G-10 equity markets, swing and position trading and technical analysis.


