MATIC Price Prediction: Polygon looks to rally 25% after minor pullback
- MATIC price has been trading below the 50% Fibonacci retracement level at $1.32 for more than a week.
- Polygon consolidates in a tight range, preparing for a retest of $1.32.
- A breakdown of the support barrier at $1.005 will invalidate the bullish thesis.

MATIC price underwent a massive correction between June 20 and June 22, creating a new range low. Since then, Polygon has tried to recover the losses but is stuck consolidating.
Considering the weak structure of Bitcoin and its likelihood of a pullback, MATIC might follow suit.
MATIC price eyes a higher high
MATIC price set up a swing high at $1.166 and underwent a minor retracement. However, the current upswing is attempting to push through this resistance level, but Polygon will either form equal highs and retrace or sweep $1.166 and pull back.
The reason behind this short-term bearishness arises due to the weak structure that Bitcoin is showing at $35,500. Due to the correlation of altcoins with BTC, MATIC will likely follow in BTC’s footsteps.
Therefore, the said correction is likely to find support at $1.034 or $1.005, where investors can expect a full-blown reversal to kick-start.
The upswing that emerges here will target $1.239, roughly 20% away from $1.034. Following the breach of this barrier, MATIC will take a jab at the 50% Fibonacci retracement level at $1.32, a 25% climb.
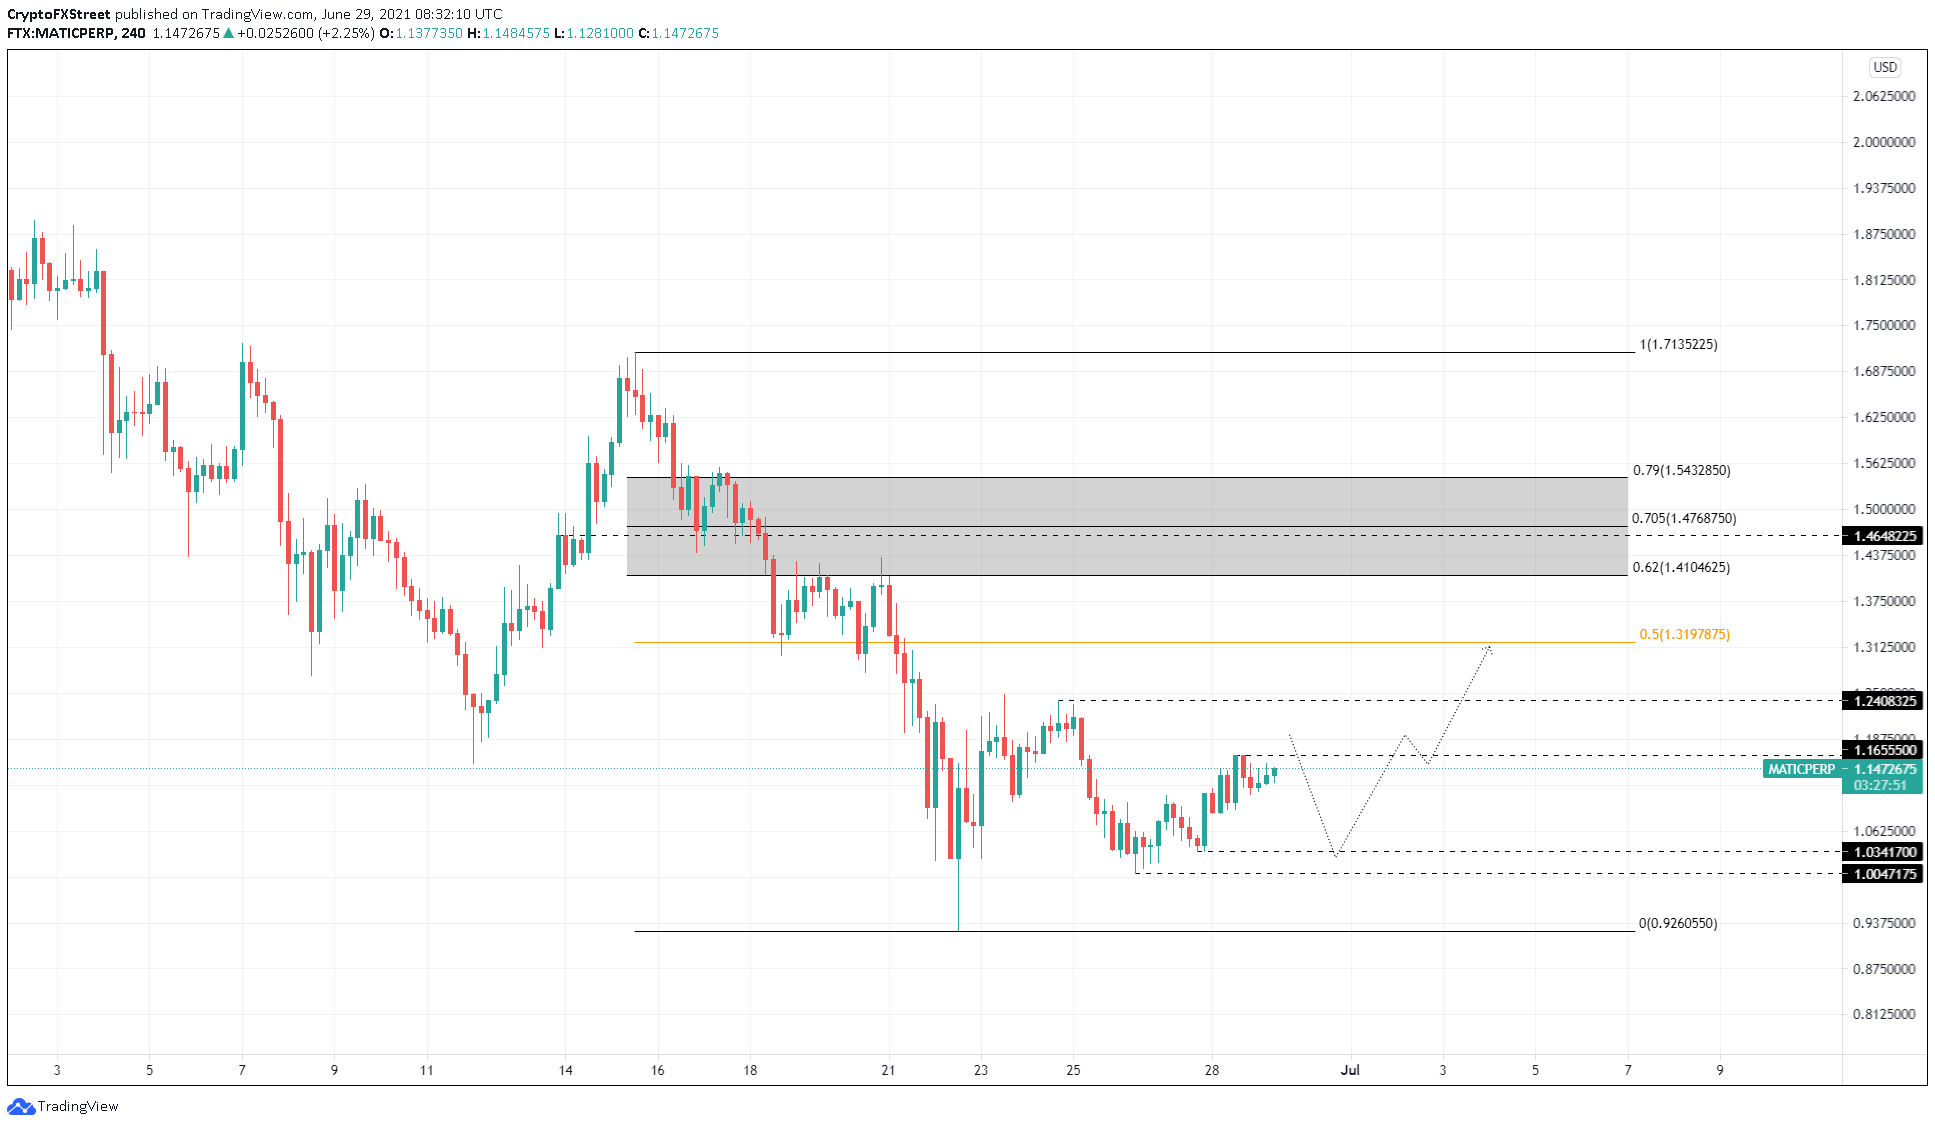
MATIC/USDT 4-hour chart
If the pullback mentioned above fails to restrict at $1.034 or $1.005, it will signify the sellers’ strength. A decisive 4-hour candlestick close below $1.005 will invalidate the bullish thesis.
Such a move will likely push MATIC price down 7% to retest the range low at $0.926.
Author

Akash Girimath
FXStreet
Akash Girimath is a Mechanical Engineer interested in the chaos of the financial markets. Trying to make sense of this convoluted yet fascinating space, he switched his engineering job to become a crypto reporter and analyst.




