MATIC Price Analysis: Polygon in no man’s land, may be exposed to 30% decline
- MATIC price shows no buying commitment or emotion after collapsing 21.4% on June 21.
- Daily Relative Strength Index (RSI) still has not recorded an oversold reading, exposing Polygon to more downside.
- New addresses on the Polygon blockchain dropped 41% over the last seven days and broke the 2021 uptrend.

MATIC price rebound following the June 22 low has been one of the worst in the cryptocurrency complex. An interesting development considering the appeal of the Polygon fundamental narrative and the notable relative strength following the May 23 low. Nevertheless, the digital asset is in no man’s land with no credible support until the May 23 low, warning Polygon investors to be disciplined in their approach.
MATIC price fall-off risk continues to dominate the guiding outlook
MATIC price fell almost 50% from the June 15 high of $1.75 to the June 22 low of $0.92. A sizeable decline following an impressive breakout above the May declining trend line. During the collapse, Polygon dismissed the 50-day simple moving average (SMA), the lower trend line of a symmetrical triangle, the crucial 2020 trend line and the anchored VWAP from April 26 at $1.32.
The decline culminated with a doji candlestick pattern on June 22, but the rebound could only climb $0.03 above the June 22 high of $1.24 before falling 13.6% yesterday. The weak bounce reflects that MATIC price did not strike conclusive support before bouncing or register an oversold reading on the daily RSI. Both suggest that Polygon could endure more selling moving forward.
As mentioned above, MATIC price is not contained by any credible support until the May 23 low of $0.74, equating to a 30% decline from the current price. Even after the May 23 low, Polygon has no visible support until the 200-day SMA at $0.53, equalling a 50% decline from the current price. On the weekly chart, there is no critical moving average until the 50-week SMA at $0.31.
The one notable support level is the 38.2% retracement of the December 2020-May 2021 advance at $0.39. The level meshes with an area of price congestion from the March-April consolidation.
Since most altcoins have tested or undercut their May lows, it is not unreasonable to conclude that MATIC price faces the same outcome. Nothing is guaranteed, but it is a scenario with validity considering the current Polygon price structure.
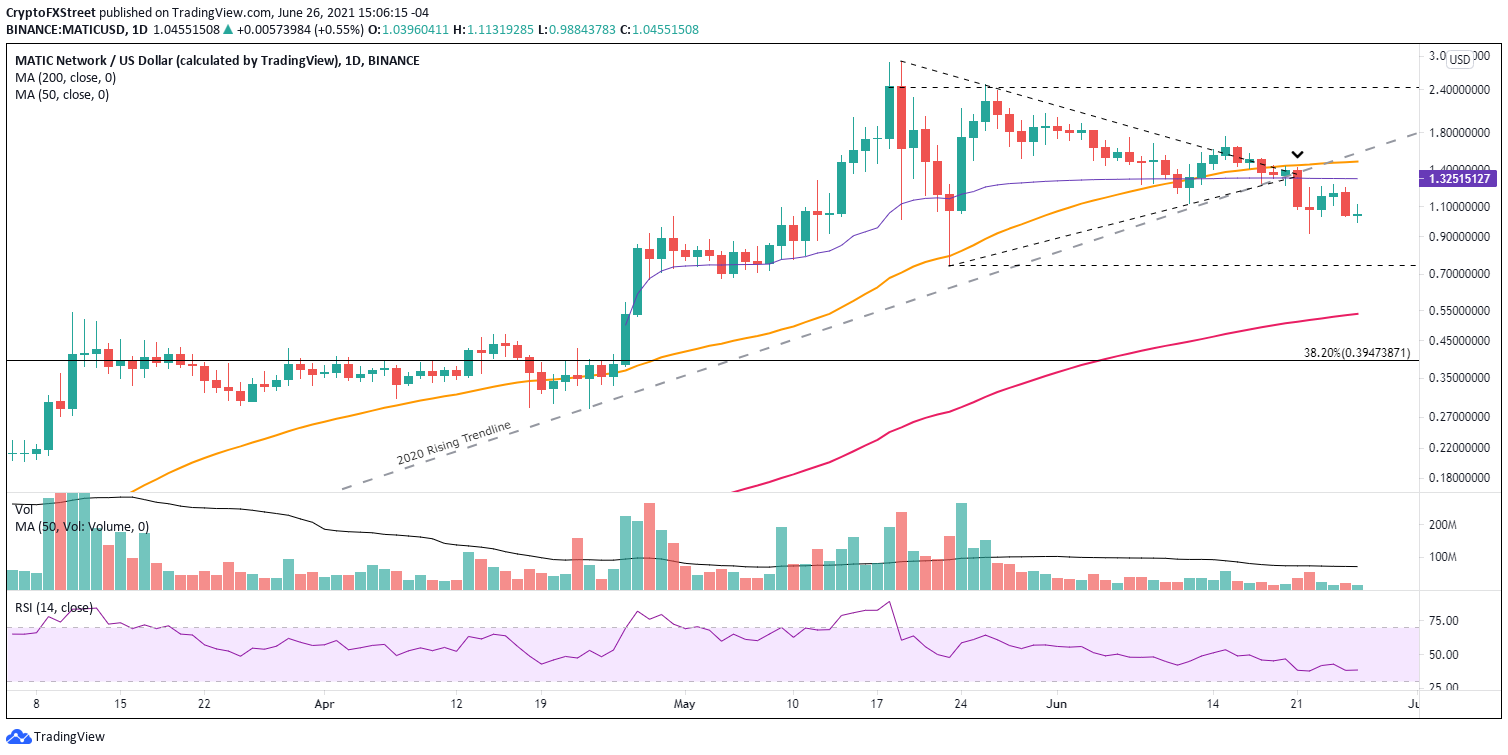
MATIC/USD daily chart
MATIC price faces an arduous path to generating a sustainable rally, but a daily close above the anchored VWAP at $1.32 would be a good start. It would create a position of strength for Polygon to assemble a break out above the 50-day SMA and the 2020 trend line.
One on-chain metric that is not supportive of a bullish resolution to the current price dilemma is the number of new addresses created on the Polygon platform. Over the last seven days, it has fallen 41% and officially broke below the 2021 trend line beginning in March.
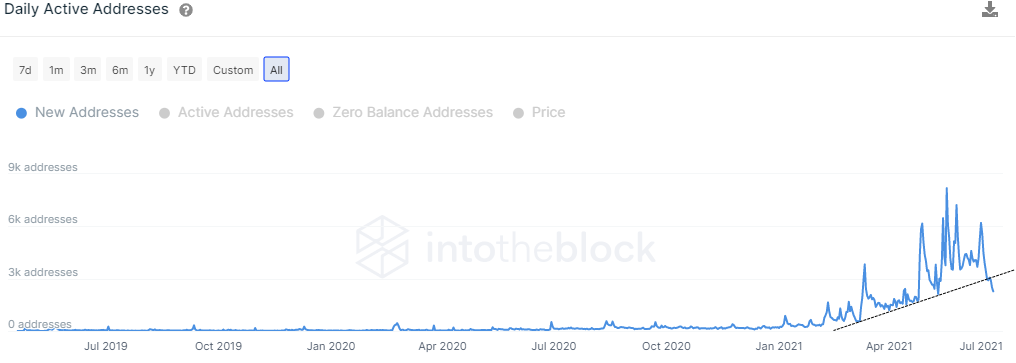
MATIC New Addresses - IntoTheBlock
A decline in new addresses is fair when there is price weakness. Still, the combination of the MATIC price break below the 2020 trend line and the fracturing of the new addresses uptrend raises doubts about the Polygon outlook.
MATIC price is at an inflection point with the probabilities stacked against it, including the technical details on the charts and the new addresses on-chain metric. From the current vantage point, Polygon will struggle to reclaim the position of relative strength leader in the cryptocurrency market.
Author

Sheldon McIntyre, CMT
Independent Analyst
Sheldon has 24 years of investment experience holding various positions in companies based in the United States and Chile. His core competencies include BRIC and G-10 equity markets, swing and position trading and technical analysis.


