MATIC Price Prediction: Polygon generates the price energy to test $1.75
- MATIC price curling below the 50-day simple moving average (SMA), logging three consecutive inside days.
- The symmetrical triangle on the four-hour chart realizes a Bollinger Band contraction that signals a sharp move.
- Polygon still carries a -13% loss in July despite the notable rebound from the monthly low.

MATIC price is nearing the resumption of the new advance as the contracting price action in the form of inside days, and a symmetrical triangle has created the price energy for a special breakout above the 50-day SMA at $1.09. Only a daily close below the June 22 low will void the bullish short-term narrative for Polygon.
MATIC price contraction should lead to noteworthy expansion
MATIC price closed the last three days with inside days on the bar charts, positioning Polygon for another attempt to break above the resistance being exerted by the psychologically important $1.00 and the 50-day SMA at $1.09.
One result of the tightening MATIC price is forming a symmetrical triangle pattern on the four-hour chart and compression in the Bollinger Band Width (BBW) to levels that preceded three marked moves in Polygon beginning in early June. Points to the explosiveness that can follow such price contractions.
The measured move of the minor symmetrical triangle is 17.55%, projecting a MATIC price target of $1.25. The target aligns with highs printed in the latter part of June.
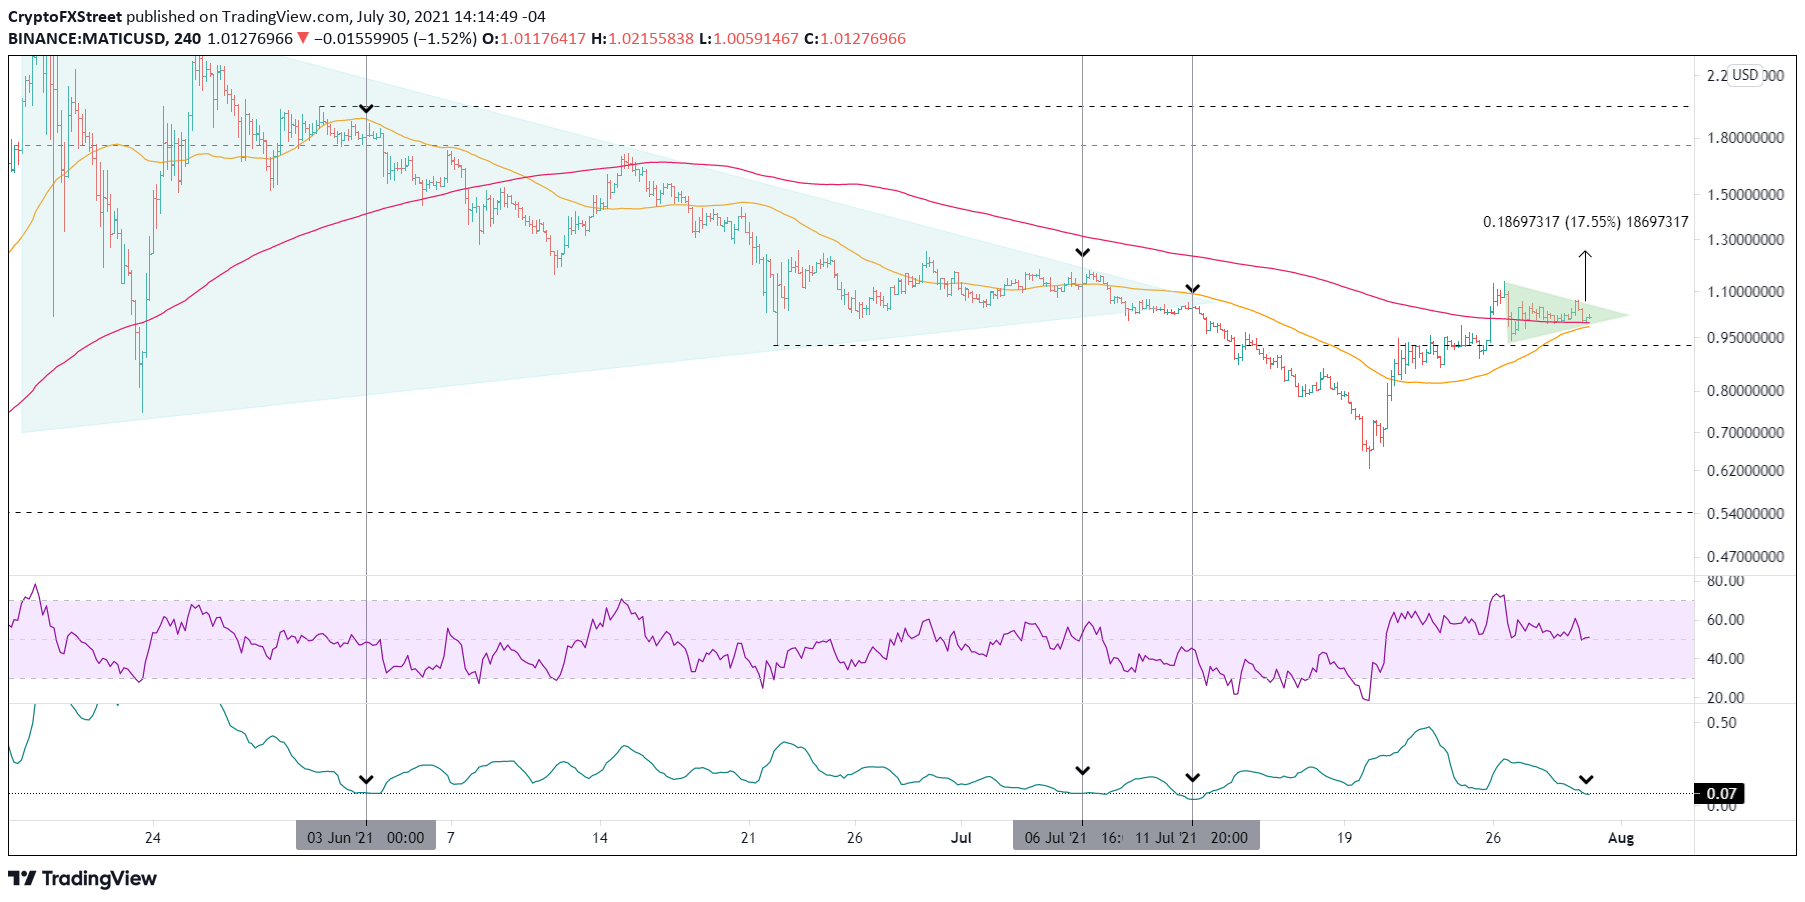
MATIC/USD 4-hour chart
If MATIC price resolves the minor symmetrical triangle to the upside and reaches the measured move target, Polygon will continue to advance to a range of price congestion around $1.75, representing a 70% leap from the current price. A move of that magnitude would shift the 50-day SMA higher, creating a new, important source of support for extending the advance to the all-time high.
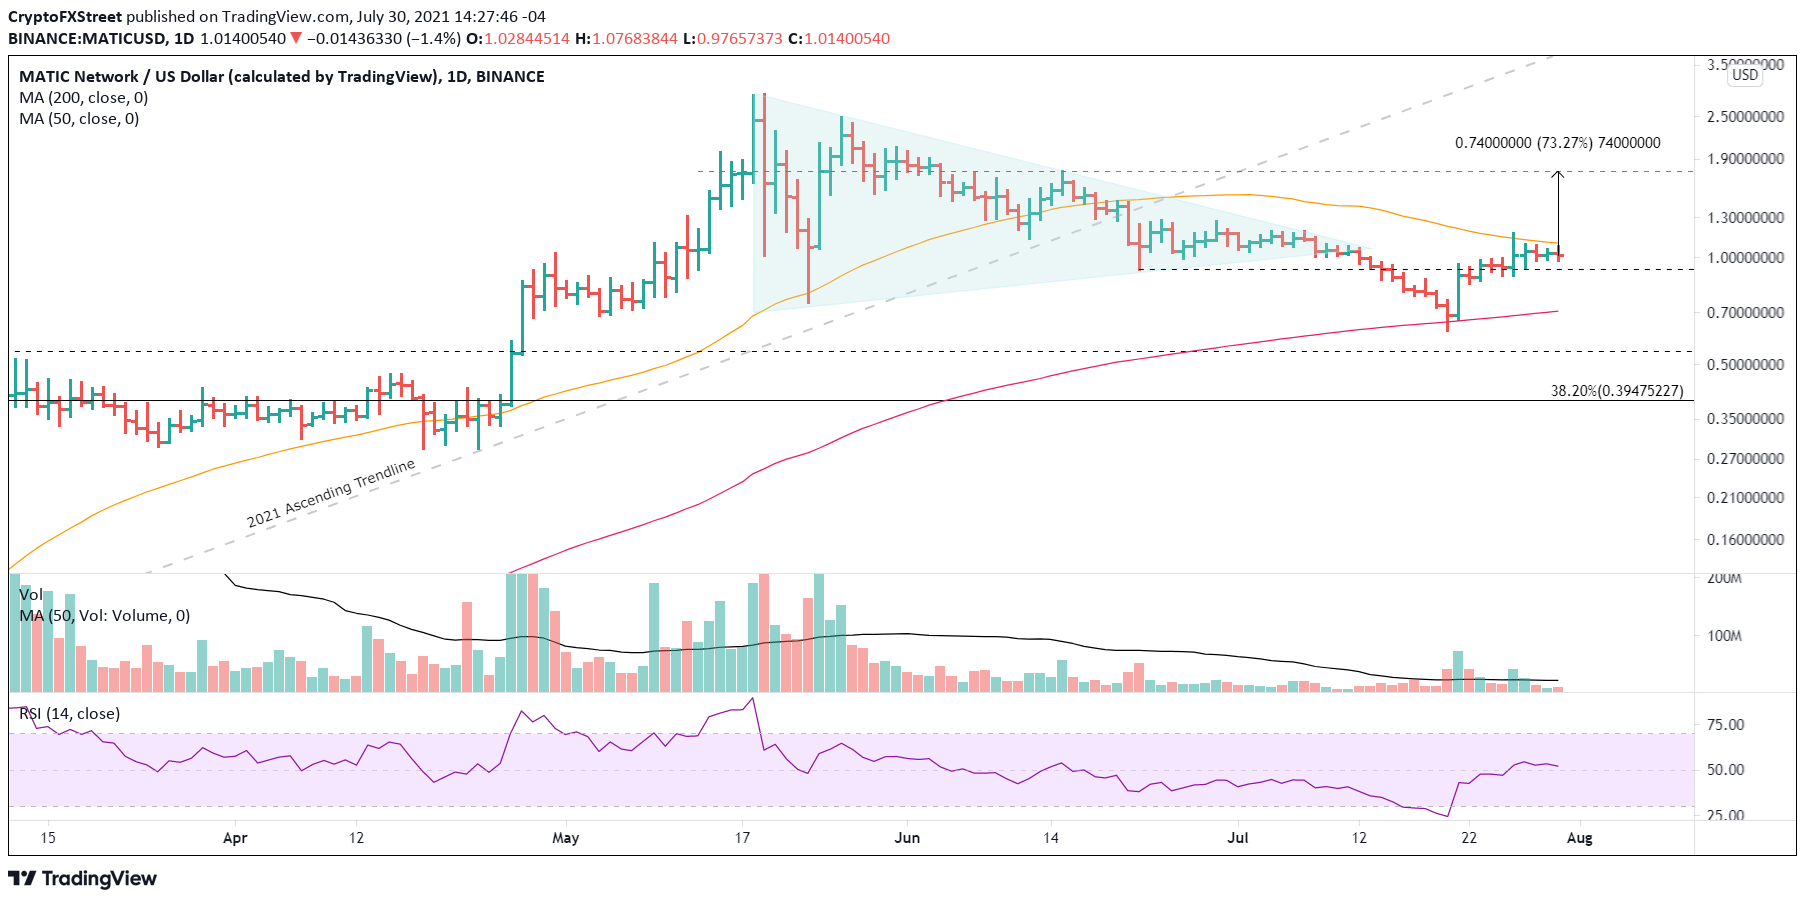
MATIC/USD daily chart
The bullish forecast needs to hold the June 22 low of $0.92 to control any MATIC price weakness that may assert itself. Otherwise, Polygon is at risk of returning to the 200-day SMA at $0.70. It would be a fatal blow to the digital asset and reopen the discussion of a deeper correction.
MATIC price is primed for higher prices, and the significant price contraction indicates that the resolution from the minor symmetrical triangle will be explosive. The question remains if the combined resistance of $1.00 and the 50-day SMA at $1.09 will prove too challenging for Polygon.
Here, FXStreet's analysts evaluate where Polygon could be heading next as it seems bound for higher highs.
Author

Sheldon McIntyre, CMT
Independent Analyst
Sheldon has 24 years of investment experience holding various positions in companies based in the United States and Chile. His core competencies include BRIC and G-10 equity markets, swing and position trading and technical analysis.


