MATIC Price Prediction: Polygon could tumble 25% if this significant level gives in
- MATIC price hints at a 25% crash as it approaches the 200 SMA on the 4-hour chart.
- Clusters of underwater investors paint a strenuous climb for the Polygon bulls.
- Addresses holding 10,000 to 10,000,000 MATIC tokens are on a rapid descent, indicating a looming threat.

The MATIC price is experiencing a full-blown sell-off as bulls’ concentration gets sparse, suggesting an incoming drop.
MATIC price continues its descent
On the 4-hour chart, the MATIC price has slowly but surely toppled significant support levels. At the time of writing, Polygon traded around $0.329 after slicing through the 50 and 100 Simple Moving Averages (SMA).
Now, the MATIC price seems to be in a minor yet questionable upswing. If the selling pressure builds up, leading to a drop below the 200 SMA at $0.28, a downtrend from a flurry of panicking investors seems likely.
This price action will result in a 25% sell-off to $0.20, which is the immediate demand barrier coinciding with the Momentum Reversal Indicator’s (MRI) State Trend Support.
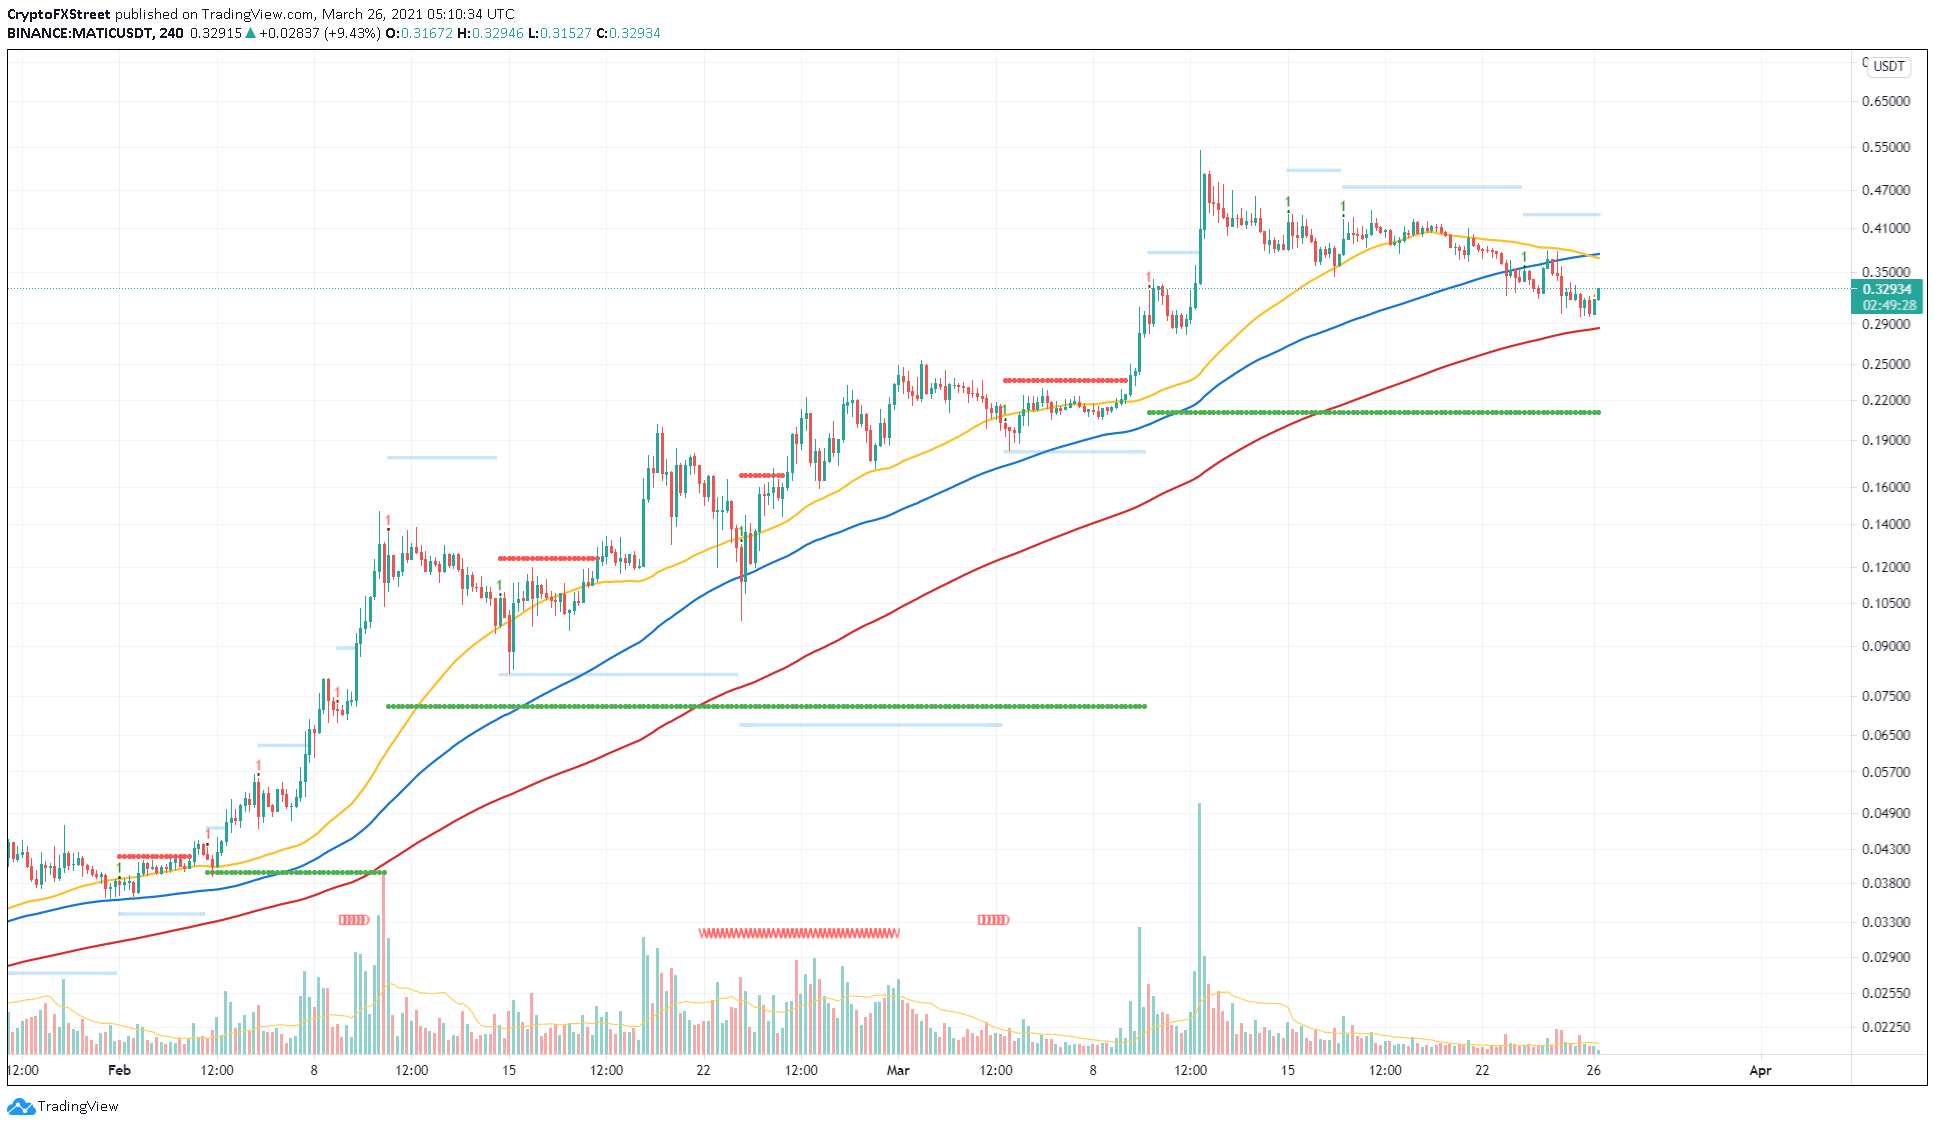
MATIC/USDT 4-hour chart
Supporting this grim outlook for MATIC is IntoTheBlock’s In/Out of the Money Around Price (IOMAP) model, which shows significant clusters of “Out of the Money” investors ranging from $0.32 to $0.37.
If the bears manage to push Polygon below the 200 SMA, it will put nearly 2,000 addresses holding roughly 100 million MATIC tokens underwater.
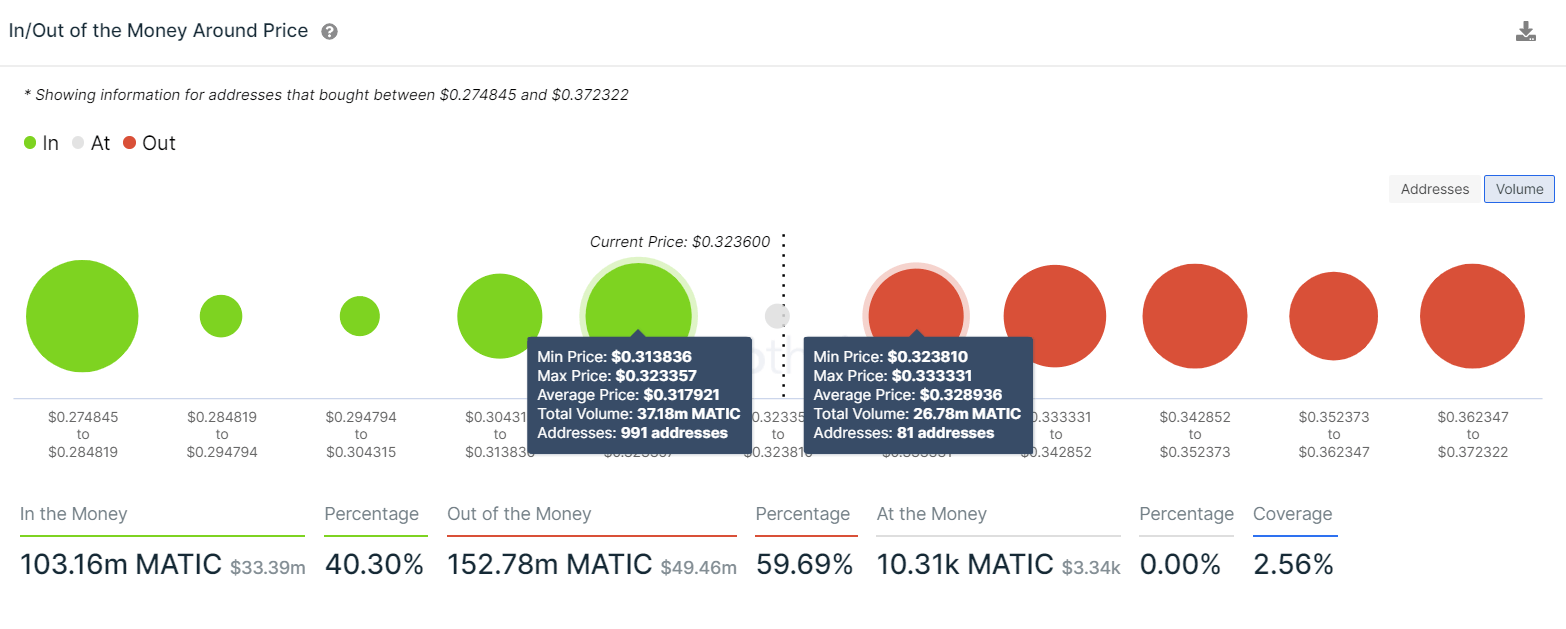
MATIC IOMAP chart
Additionally, whales holding between 10,000 to 10,000,000 MATIC have been dropping rapidly. For instance, the number of addresses holding 100,000 to 1,000,000 MATIC saw a 6.5% reduction since March 10.
This decrease indicates that whales are either redistributing their holdings or booking profits, which falls in line with the dropping prices.
Therefore, the MATIC price is in for a crash, especially if the 200 SMA at $0.28 is breached.
%20[10.35.17,%2026%20Mar,%202021]-637523355154337375.png)
MATIC Holders Distribution chart
On the flip side, if buyers scoop up MATIC, preventing a decline below the 200 SMA, the bearish scenario can be postponed for a short time. A spike in bullish momentum that pushes past $0.43 will convert the underwater investors to “In the Money.” This move will not only promote an upswing in MATIC price but also adds bullish momentum.
Author

Akash Girimath
FXStreet
Akash Girimath is a Mechanical Engineer interested in the chaos of the financial markets. Trying to make sense of this convoluted yet fascinating space, he switched his engineering job to become a crypto reporter and analyst.



