MATIC price forms bear trap as Polygon heads to $2.6
- MATIC price develops bear trap, creating a short-squeeze opportunity for bulls.
- Key bullish entry levels are necessary to prevent a selloff.
- Downside risks remain despite bullish reversal signals.

MATIC price remains inside a broader rising wedge pattern on its candlestick chart and has struggled to find support. However, the Point and Figure chart shows that a move above $1.70 could trigger some intense buying pressure and deny bears their selloff.
MATIC price prepares for a nearly 50% price spike higher despite current downside risks
MATIC price has a long opportunity on its $0.05/3-box Reversal Point and Figure chart. The long idea is a buy stop order at $1.75, a stop loss at $1.55 and a profit target at $2.55. The entry would complete a breakout out of a double-top while simultaneously confirming a bullish Point and Figure reversal pattern known as a Bear Trap.
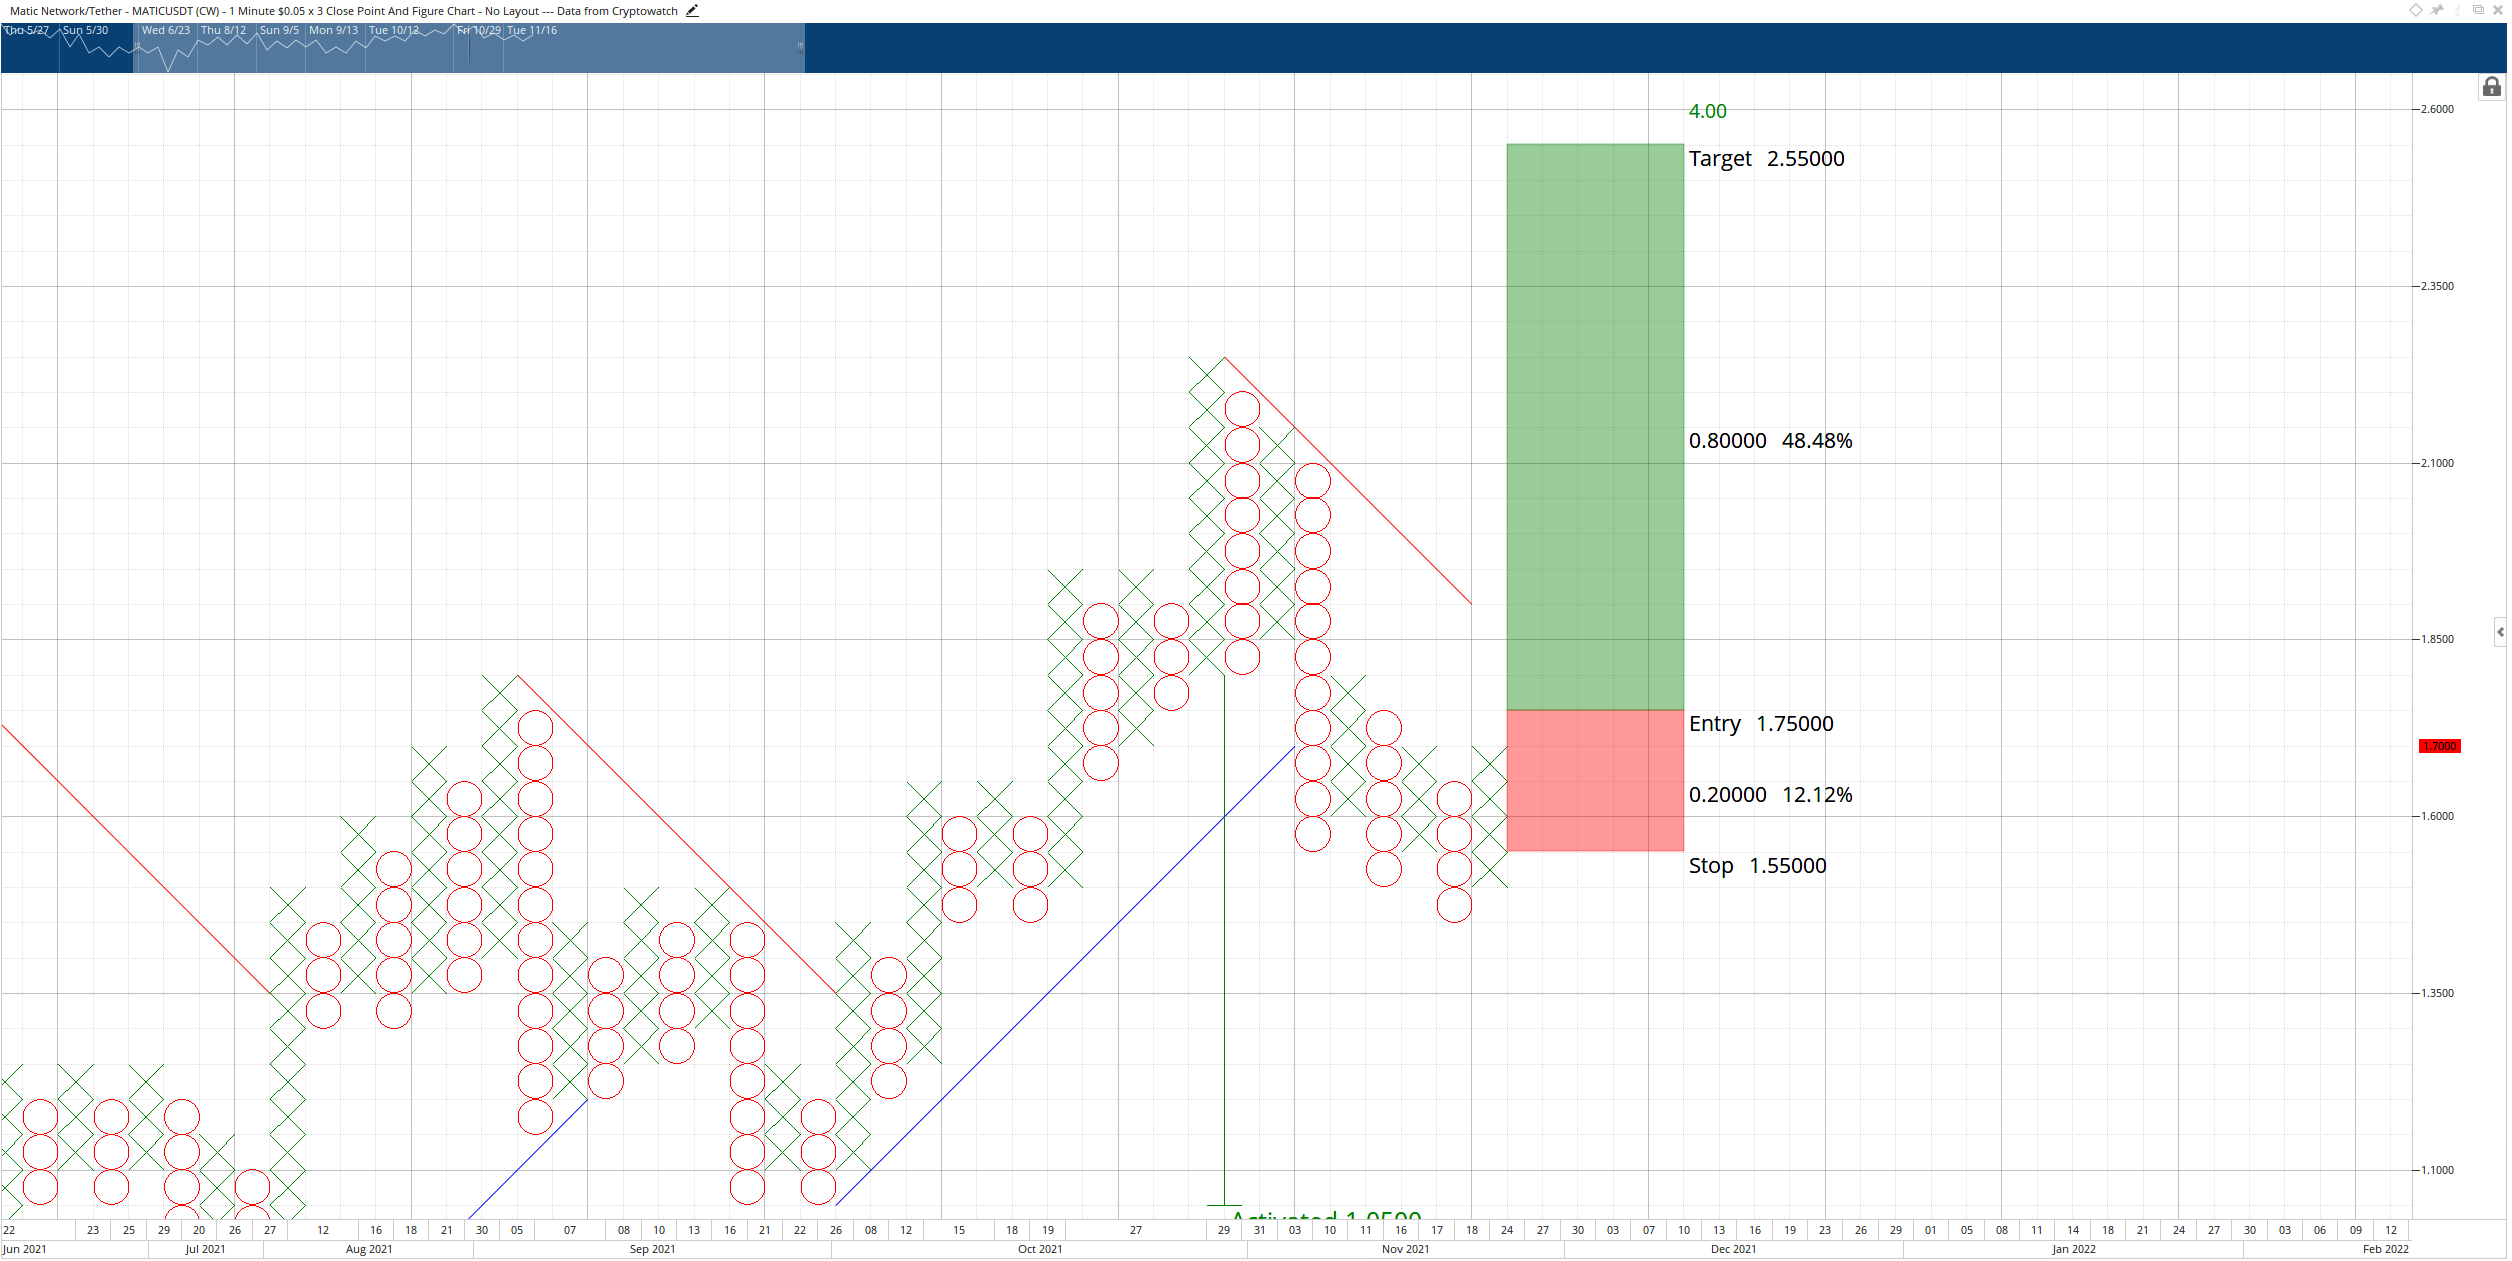
MATIC/USD $0.05/3-box Reversal Point and Figure Chart
Buyers are not entirely out of bearish territory, however - the daily Ichimoku chart shows MATIC is very close to completing an Ideal Bearish Ichimoku Breakout entry. The 50% Fibonacci retracement at $1.53 is acting as immediate support, but failure to hold there means MATIC price could drop even lower.
MATIC price will enter a capitulation zone at or below $1.40. A close at $1.40 would position MATIC price below the Cloud, the 100% Fibonacci expansion, and the lower trendline of the rising wedge pattern. More importantly, though, the Chikou Span would be below Senkou Span B. A close at $1.40 would mean MATIC may not find support until the 161.8% Fibonacci expansion at $0.95.
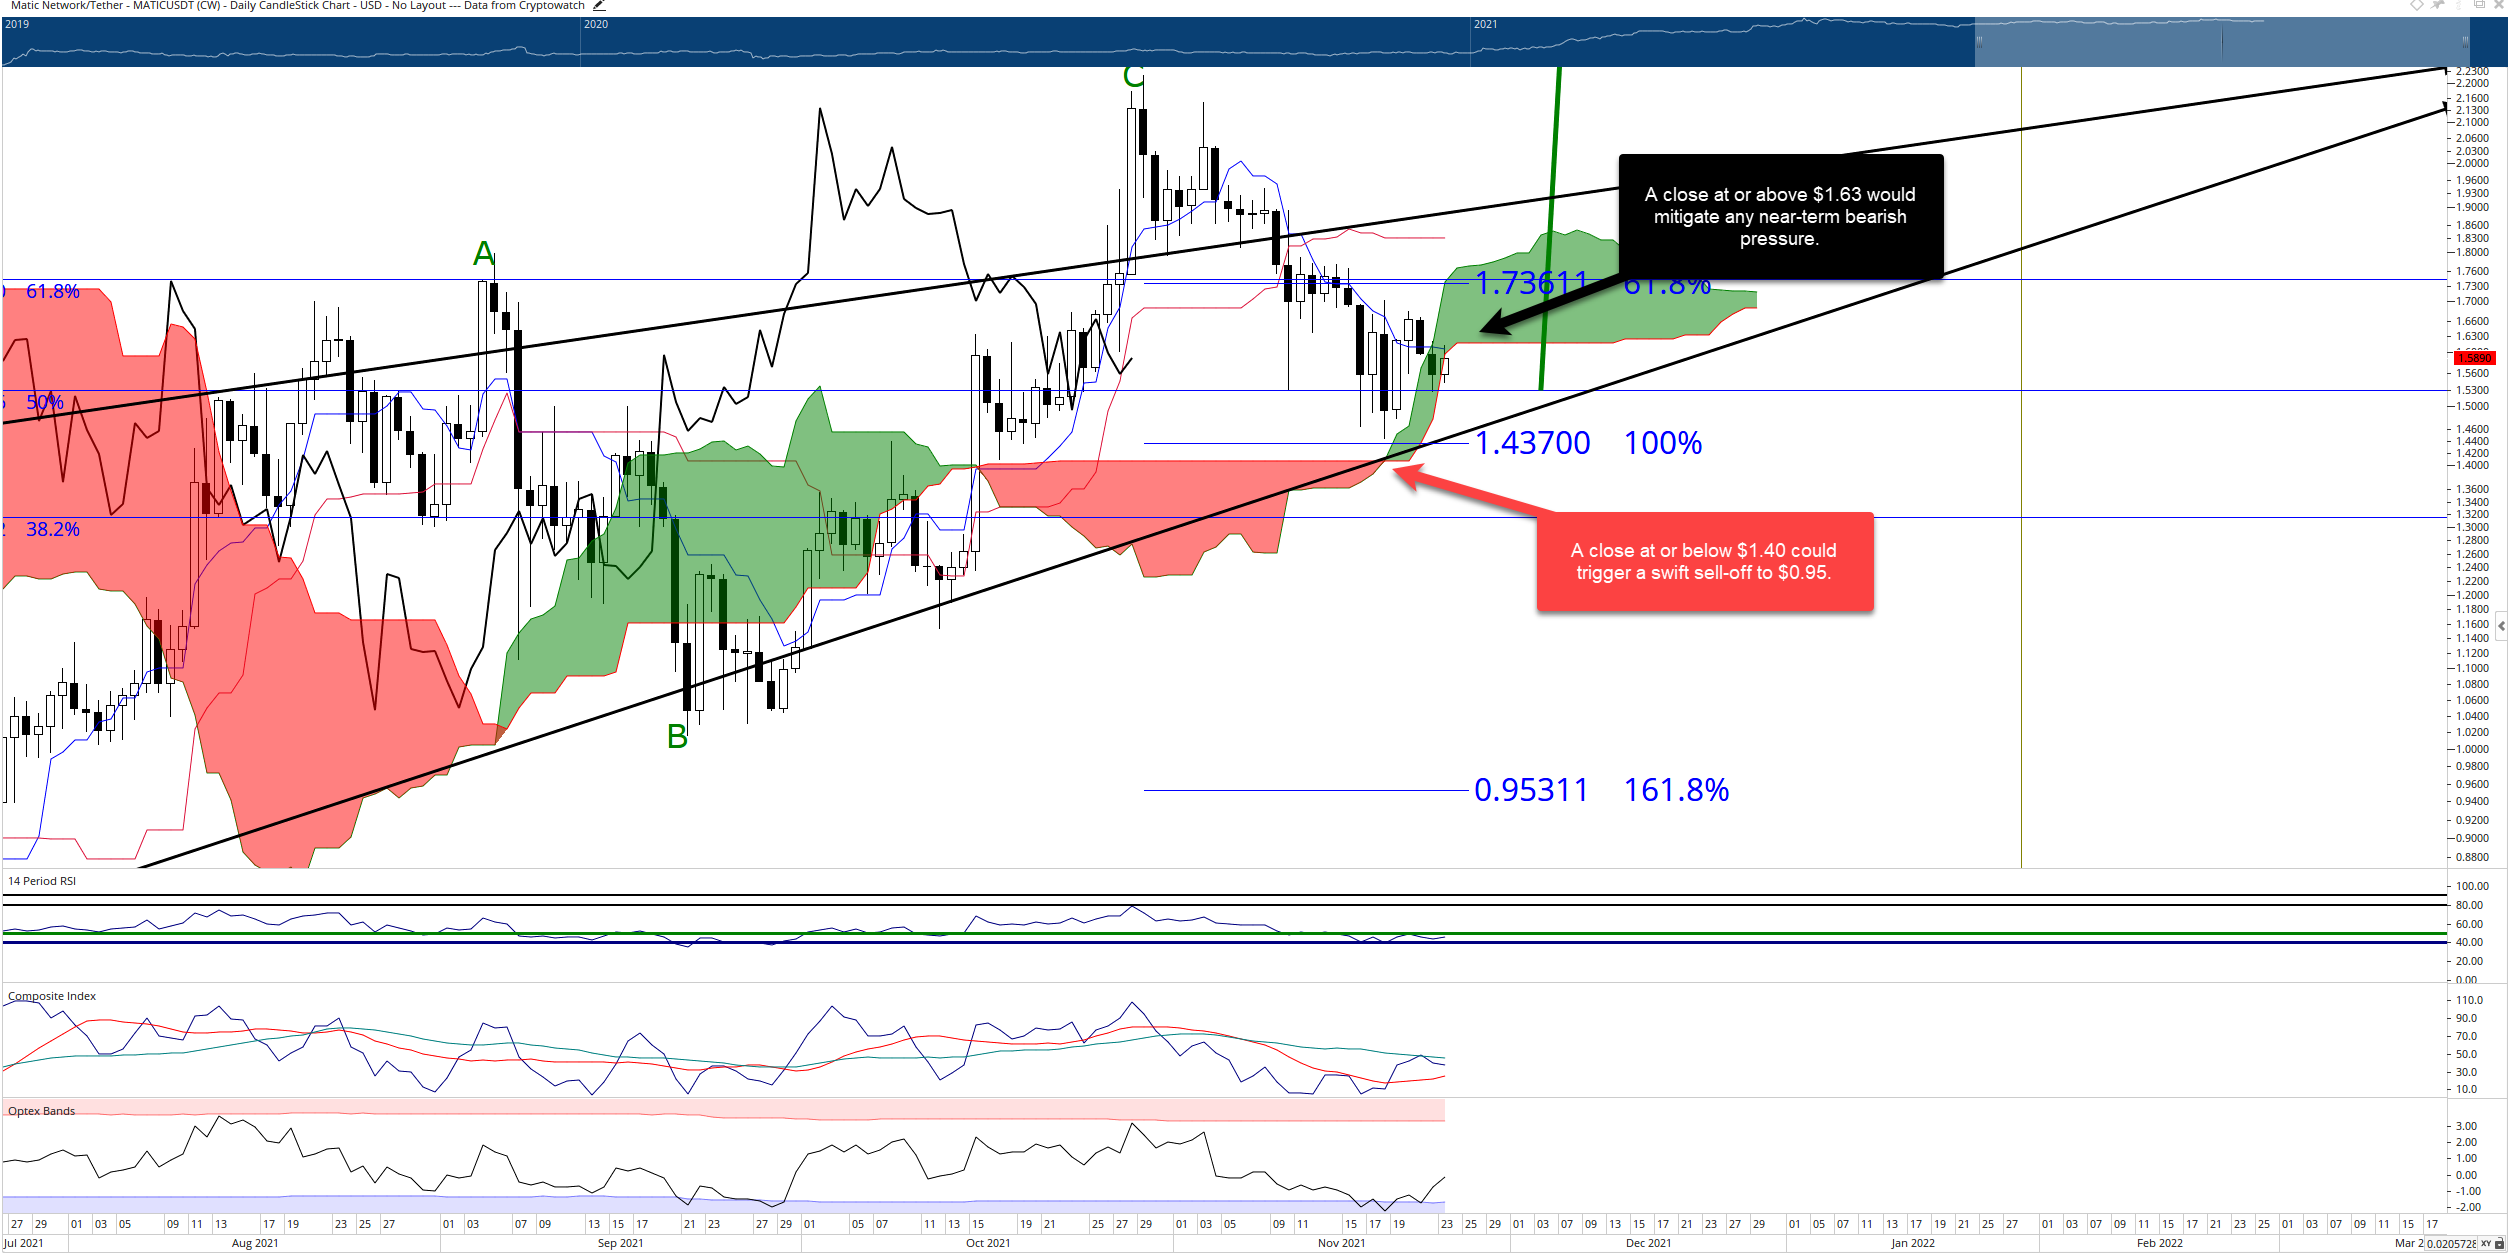
MATIC/USDT Daily Ichimoku Chart
The near-term bearish outlook could be mitigated if MATIC price closes above the Tenkan-Sen and Senkou Span B at $1.63. From there, the road to the Point and Figure buy stop entry is more straightforward and more probable.
Author

Jonathan Morgan
Independent Analyst
Jonathan has been working as an Independent future, forex, and cryptocurrency trader and analyst for 8 years. He also has been writing for the past 5 years.


