MATIC Price Forecast: Polygon breaks, may unleash a stampede for the exits
- MATIC price has triggered a symmetrical triangle pattern with a measured move of -74%.
- Today’s -6% drop follows two straight inside days, preparing investors for a notable price expansion.
- The June 22 low at $0.921 may halt a devastating Polygon decline.

MATIC price plotted a large symmetrical triangle pattern on the charts that is officially triggering today. With the break to the downside, Polygon is now vulnerable to a large decline that may test the 200-day simple moving average (SMA) if the broader cryptocurrency complex suffers a renewed surge in selling pressure.
MATIC price struggles as bears grab control of the trendy token
The -21% drop on June 21 through the ascending 2021 trend line was a huge warning sign to Polygon faithful and created a new range of resistance for MATIC price that combined the trend line with the 50-day SMA and the Anchored VWAP. The digital asset attempted to stabilize the sharp drop with a doji candlestick on June 22, but the resulting price action was characterized by indecision and accompanied by plunging volume numbers.
Today’s triggering of the symmetrical triangle pattern has exposed MATIC price to a significant decline. The measured move of the Polygon symmetrical triangle is approximately 74%, projecting a final low of $0.269. A collapse of that magnitude would defeat the 200-day SMA support at $0.624, the 38.2% Fibonacci retracement of the 2021 advance at $0.394 and the lows of the trading range defined during March-April at $0.287.
A daily close below the June 22 low of $0.921 would confirm the new leg lower from the symmetrical triangle pattern. The next credible level of support for Polygon is the May 23 low of $0.743 and then the 200-day SMA at $0.624, representing a 36% decline from the current MATIC price.
An alternative Polygon support level is the March 11 high of $0.544, marking a 44% decline from the current MATIC price. A continuation to the measured move target at $0.269 would be a surprise.
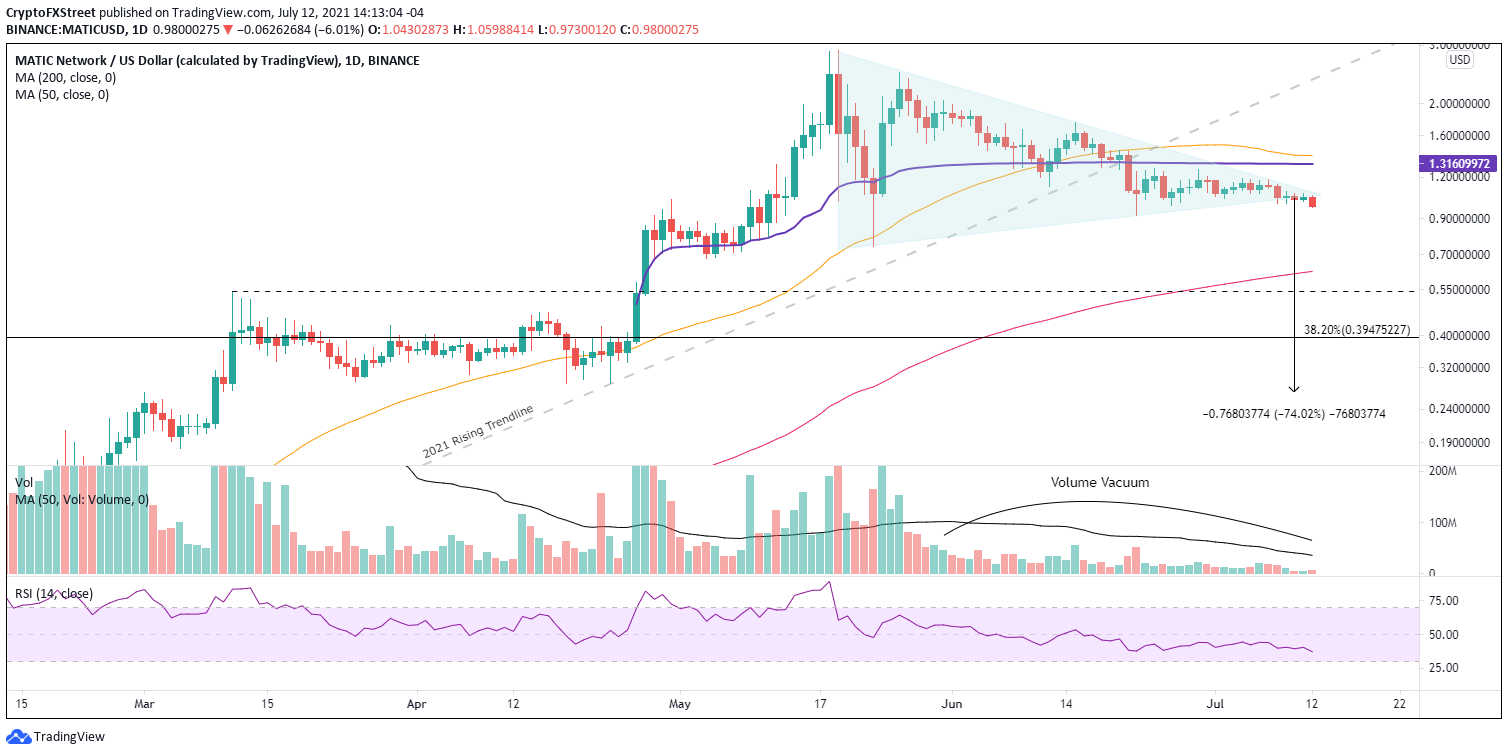
MATIC/USD daily chart
Today the psychologically important $1.00 may interrupt the developing Polygon sell-off, but it will take a close above $1.18 to initiate a reconsideration of the bearish forecast for MATIC price.
For the moment, MATIC price is in the early stage of a new correction that may yield a tremendous loss for committed Polygon investors. However, the digital asset requires more confirmation before the weakness becomes a high probability short opportunity.
Author

Sheldon McIntyre, CMT
Independent Analyst
Sheldon has 24 years of investment experience holding various positions in companies based in the United States and Chile. His core competencies include BRIC and G-10 equity markets, swing and position trading and technical analysis.


