Why MATIC could enter a new bear market
- MATIC price breakdown from a descending triangle raises the odds of lower prices moving forward.
- The convergence of numerous technical indicators above the current price project an obstacle for any strength in the short term.
- MVRV 365-day ratio designates Polygon as overvalued, and new addresses plummet in the last two weeks.

MATIC price had been a relative strength leader in the cryptocurrency complex. Still, lately, the failure to hold key technical levels has raised the probability of a weaker price in the medium term. The overhang of key points of resistance coupled with a bearish pattern suggests that Polygon investors will not be rewarded with better profit outcomes.
MATIC price formation warns of troubled waters ahead for investors
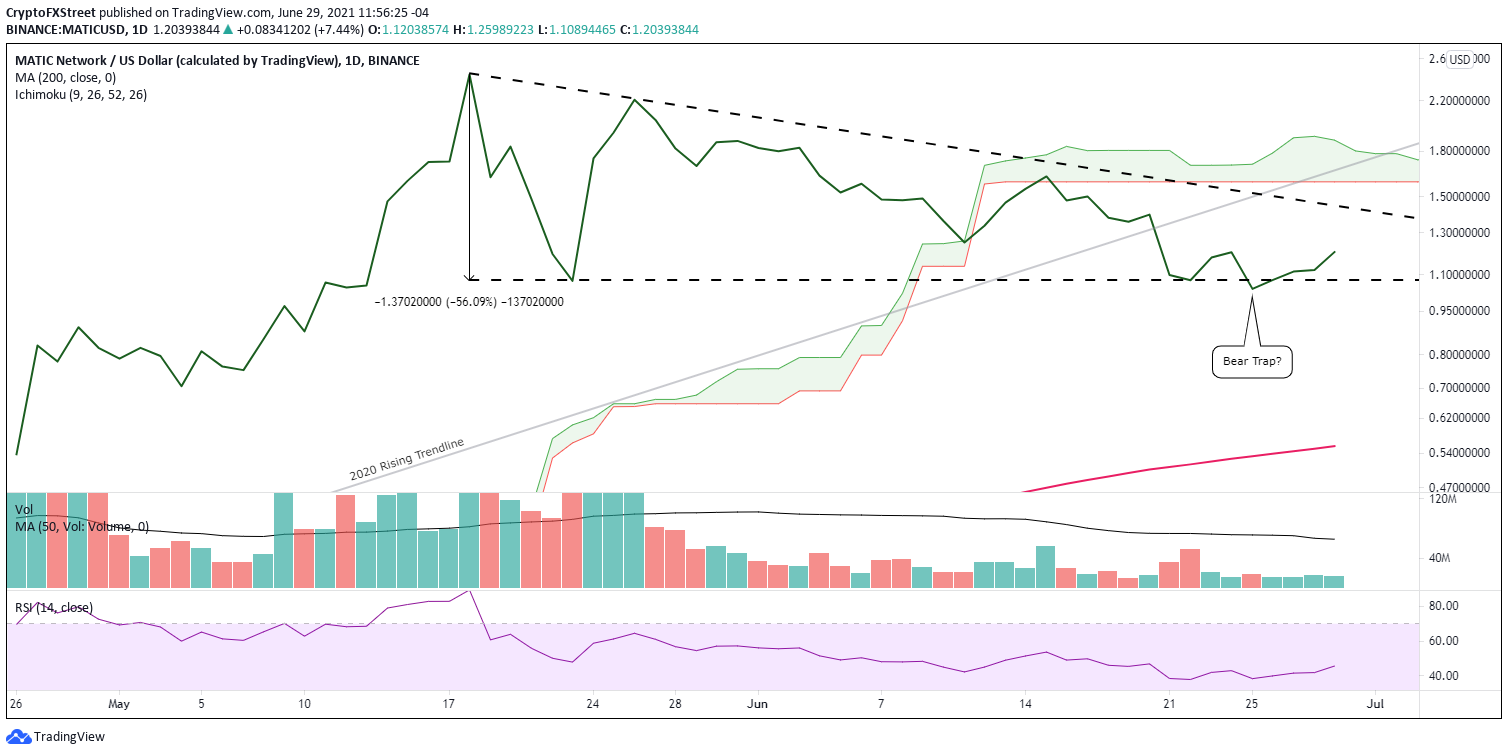
MATIC price established a descending triangle pattern on a line chart beginning at the May 18 high and extending into the end of June. The pattern is distinguished by a trend line that connects a series of lower highs and a second horizontal trend line that connects a series of lows. The framework generally develops during a declining trend as a continuation pattern; however, there are numerous examples of descending triangles forming as reversal patterns, as with Polygon. Regardless of where they form, descending triangles are bearish and indicate distribution.
On June 22, MATIC price printed the second reaction low to create the horizontal trend line. On June 25, Polygon briefly undercut the June 22 low of $1.075 and the original reaction low on May 23 of $1.072 before rebounding higher. The bounce could be a bear trap, but it may just another leg higher within the context of filling the triangle pattern. For now, the pattern remains bearish until there is a successful breakout above the triangle’s upper trend line.
The measured move of the descending triangle pattern is 56% or a MATIC price low of $0.464.
MATIC/USD daily chart
MATIC price encounters a challenging climb
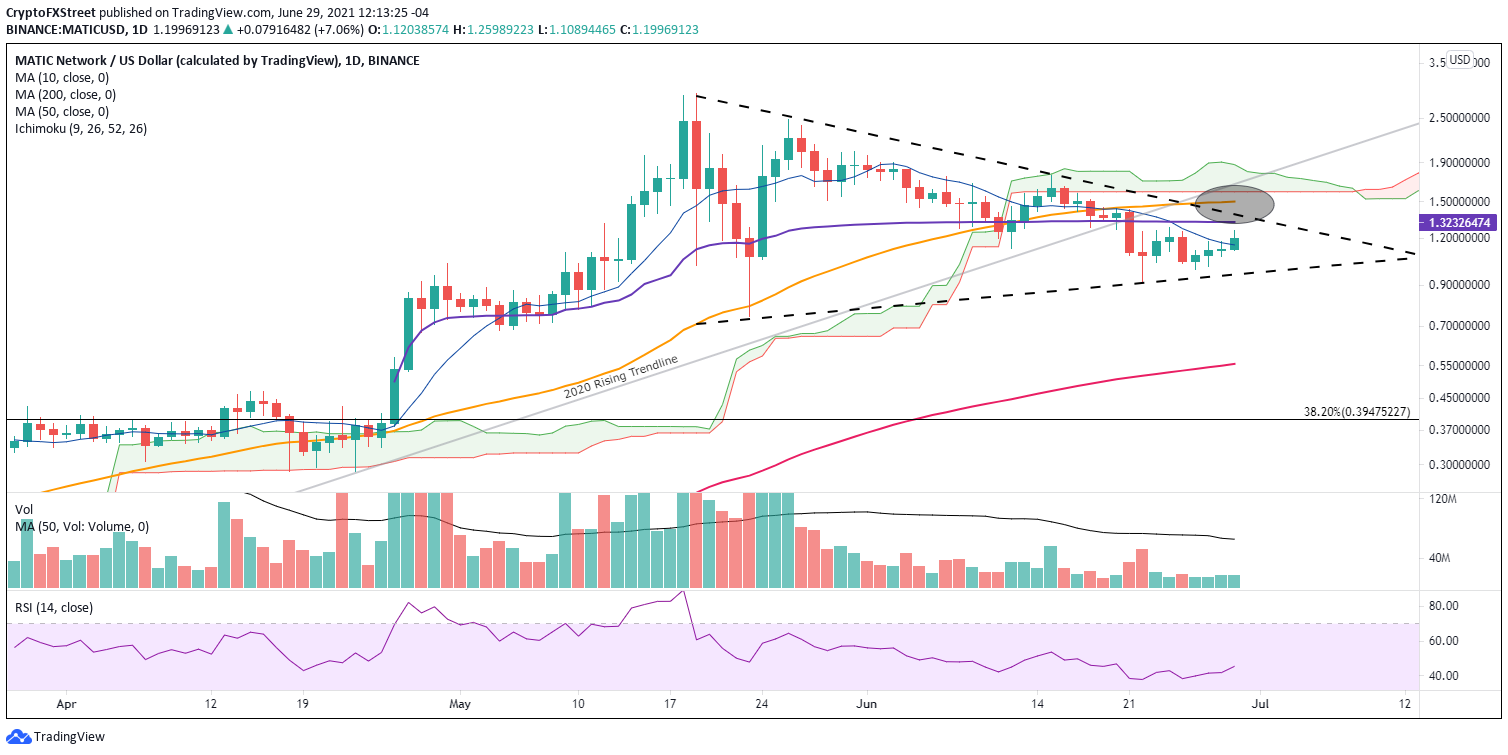
MATIC price confronts a myriad of resistance levels on the daily and weekly chart. The resistance of note is the anchored VWAP from April 26 at $1.323, followed closely by the symmetrical triangle’s upper trend line at $1.39, and finally, the 50-day SMA at $1.500.
The meshing of the three resistance points is reinforced by the daily Ichimoku Cloud, the 2020 broken trend line and the 10-week SMA at $1.321. Combined, all the levels configure an intimidating barrier that puts downward pressure on Polygon and requires more than a dead-cat bounce, facilitated by meager volume totals, to overcome.
MATIC/USD daily chart
Polygon remains overvalued on a key long-term metric
One on-chain metric that suggests more MATIC price weakness is around the corner is the 365-day MVRV ratio, currently at 140.53%. It reveals that the average gain of all addresses that have acquired MATIC in the previous year stands at 140.53%. A notable comment about the potential selling pressure that remains despite the sell-off in May and recently in June.
Generally, the higher the MVRV ratio, the greater the unclaimed profits, thus the higher the risk that Polygon holders will begin to sell and lower their exposure. This is why it is believed that extremely high MVRV ratios, such as the MATIC ratio, indicate overvalued conditions and reason to sell. In contrast, very low MVRV ratios may offer a timely opportunity to accumulate.
The MATIC MVRV ratio is significantly higher than the majority of cryptocurrencies after the correction. It confirms a reservoir of selling pressure that could enter the market should things turn negative again in the cryptocurrency complex or if the Polygon fundamental story loses momentum.
Moreover, the elevated MVRV ratio demonstrates enough potential selling pressure to drive MATIC price to the measured move target of $0.464, or a decline of 56%.
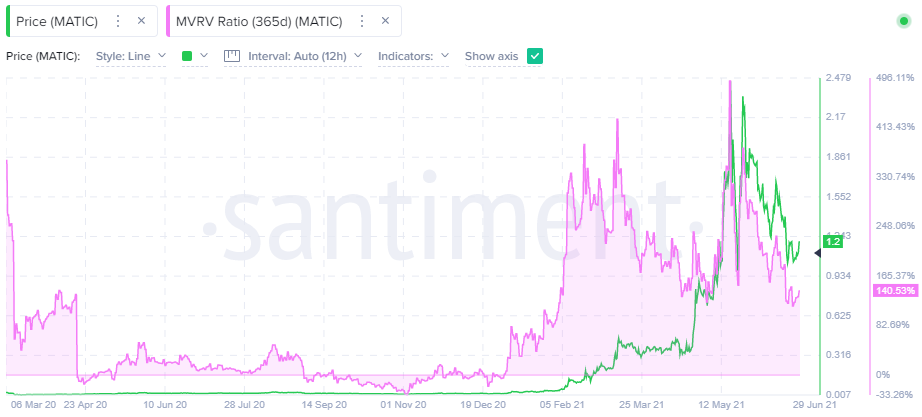
MATIC 365-day MVRV - Santiment
Interest in Polygon plummets in the second half of June
A second on-chain metric countering MATIC price strength is the number of new addresses created on the Polygon platform. The number has fallen 63% since June 15 and officially broke the 2021 trend line beginning in March. The trend line was held in May.
The substantial decline in interest in Polygon in the second half of June, despite MATIC price not nearing the May low, raises doubts about the outlook for the digital asset.
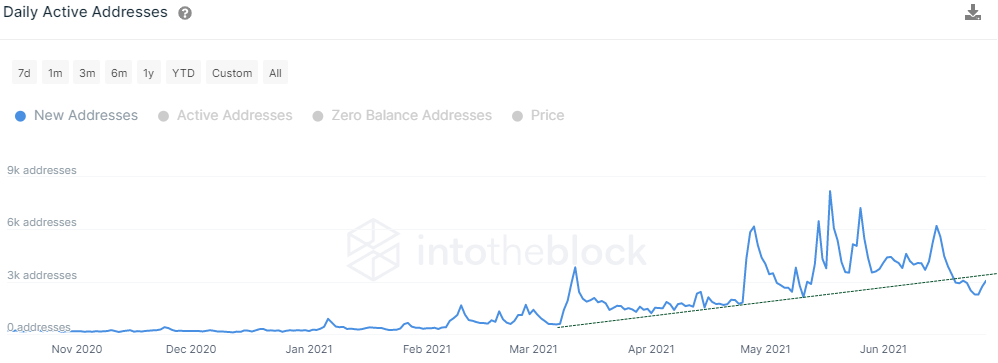
MATIC - New Addresses - Santiment
MATIC price is at an inflection point with the probabilities stacked against it, including the technical details on the charts and the on-chain metrics. From the current vantage point, Polygon will test the May lows, and if selling pressure accelerates, it will fall to the 200-day SMA at $0.555 or the measured move target of $0.464.
Author

Sheldon McIntyre, CMT
Independent Analyst
Sheldon has 24 years of investment experience holding various positions in companies based in the United States and Chile. His core competencies include BRIC and G-10 equity markets, swing and position trading and technical analysis.