MATIC sellers test bearish reversal pattern that could return Polygon to $1.80
- MATIC price faces a third consecutive day of testing the lower trendline of a rising wedge.
- Failure to hold inside the rising wedge could trigger a flash-crash.
- Upwards momentum continues to constrict and consolidate.

MATIC price is now on its sixth test of the lower rising wedge trendline since October 1. All previous attempts to push MATIC to a close below the rising wedge have failed.
MATIC price down over 16% for the week, but it could drop over 30% before finding support
MATIC price has not been kind to bulls since reaching a new all-time high in the last week of December. As a result, MATIC is down more than 16% for the week and more than 30% from its recent all-time high. Moreover, the weekly Ichimoku chart warns that further downside pressure is probable.
A close at or below $2.05 on the weekly chart would position MATIC price below the weekly Tenkan-Sen and the lower trendline of the rising wedge. That event could trigger enough selling pressure to push MATIC to the next support zone within the Ichimoku Kinko Hyo system, the Kijun-Sen at $0.180.
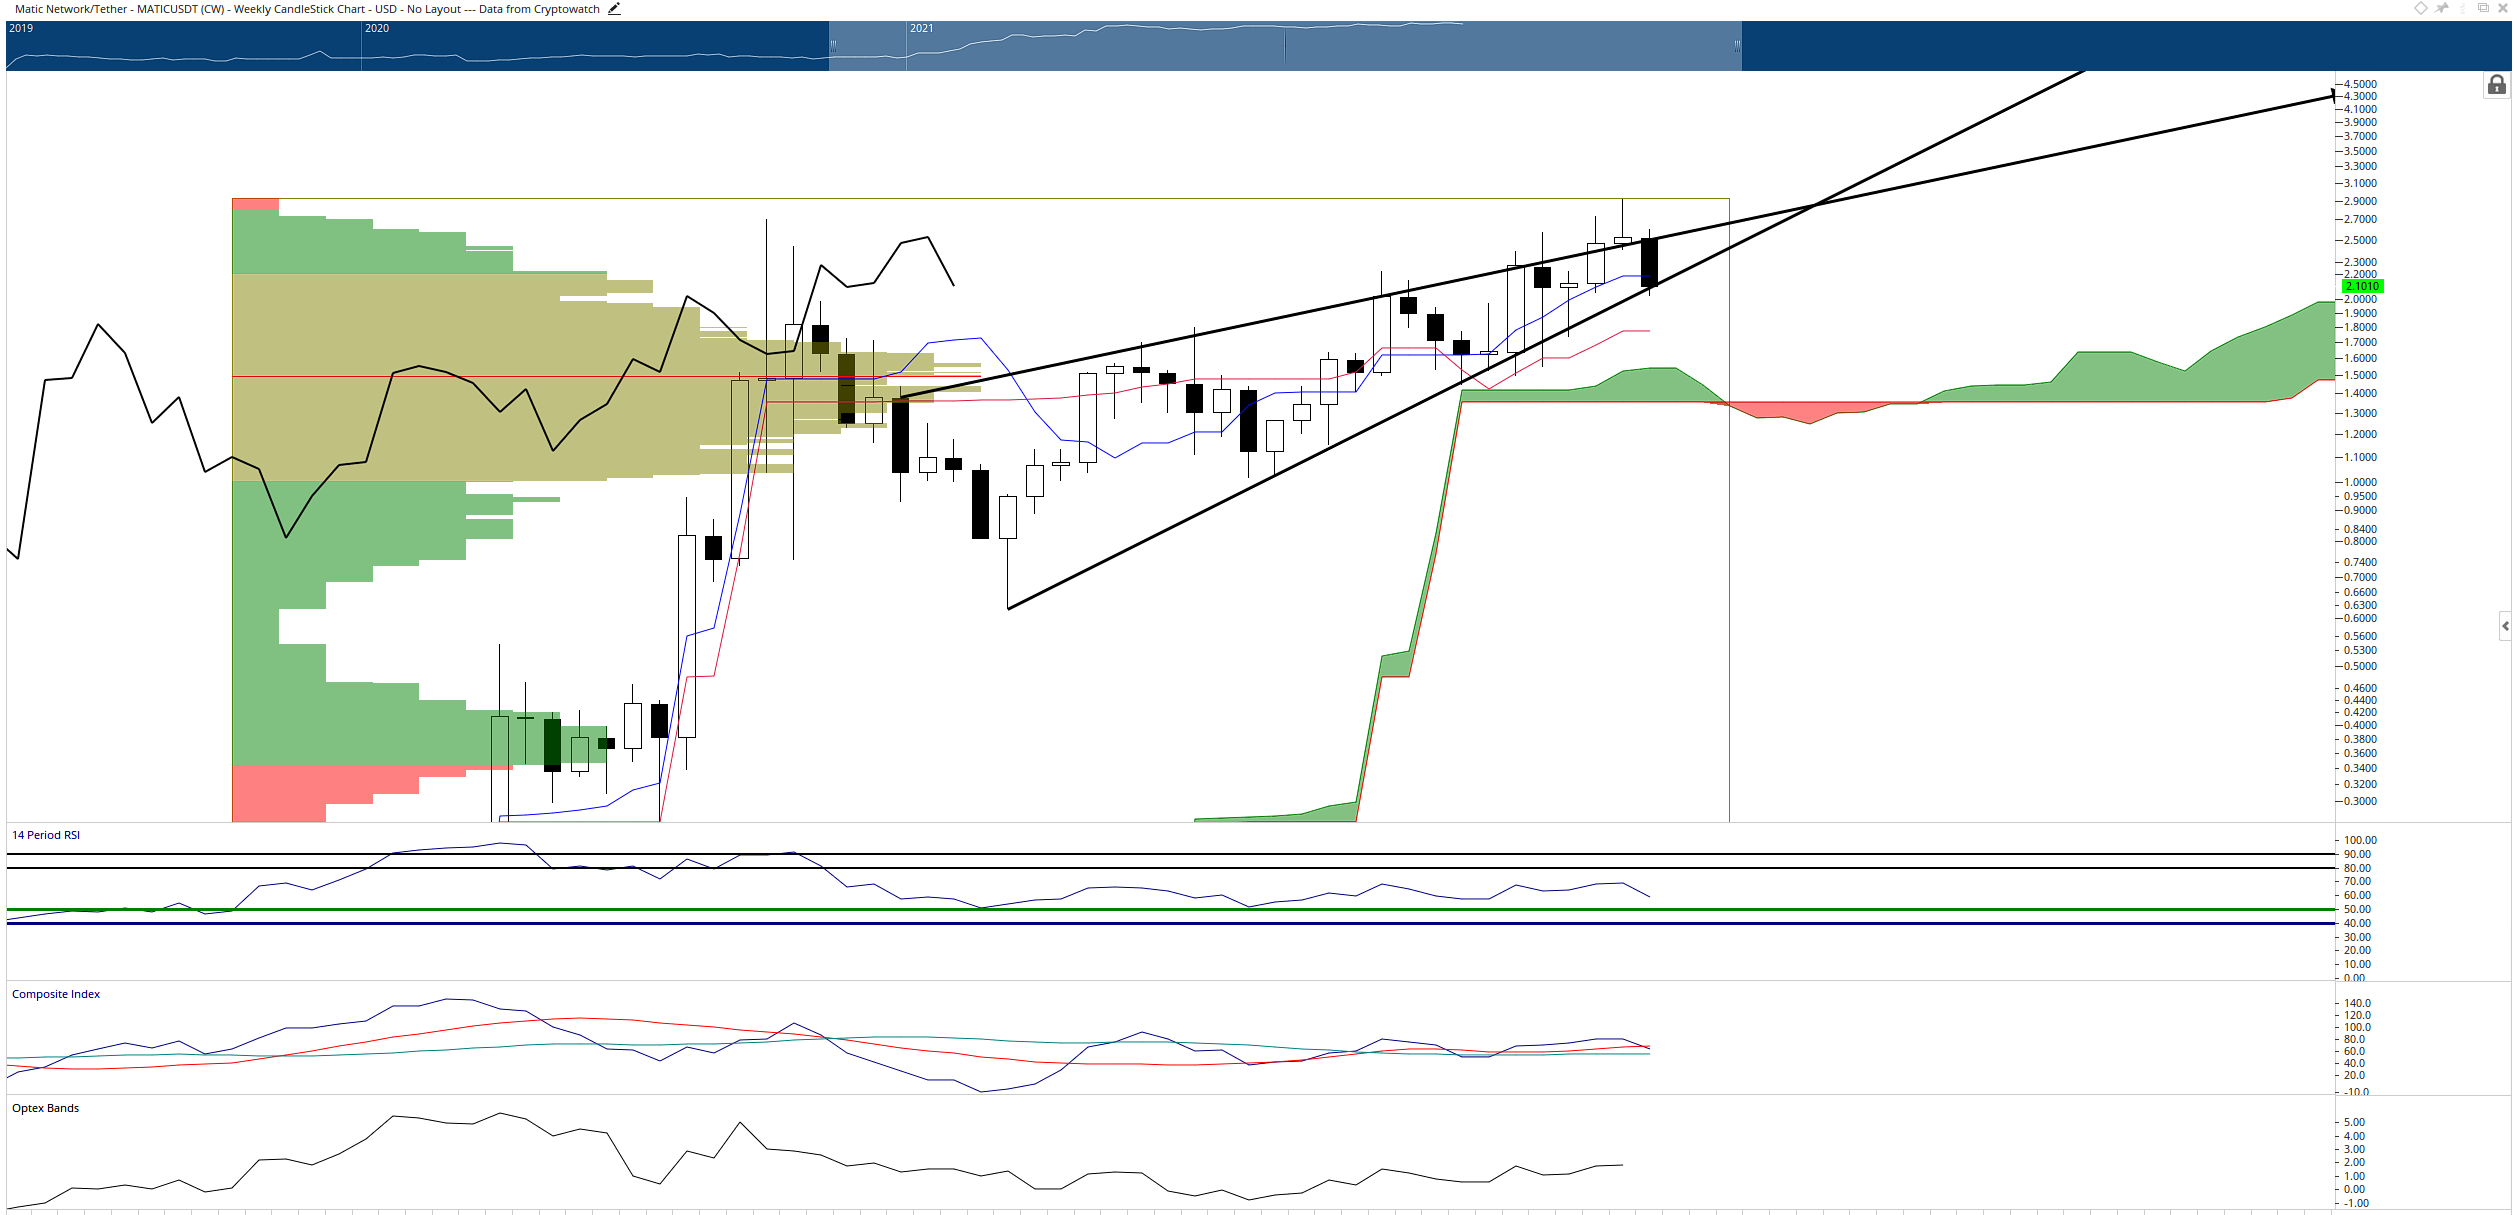
MATIC/USDT Weekly Ichimoku Chart
The oscillators support a move south. The Composite Index has crossed below its fast-moving average and is at a slope that suggests it could dip below its slow-moving average as well—considering that the Relative Strength Index is not at an oversold level, the likelihood of a drop increases.
However, there is some evidence on the daily Ichimoku chart that could mitigate and even invalidate the bearish outlook on the weekly chart.
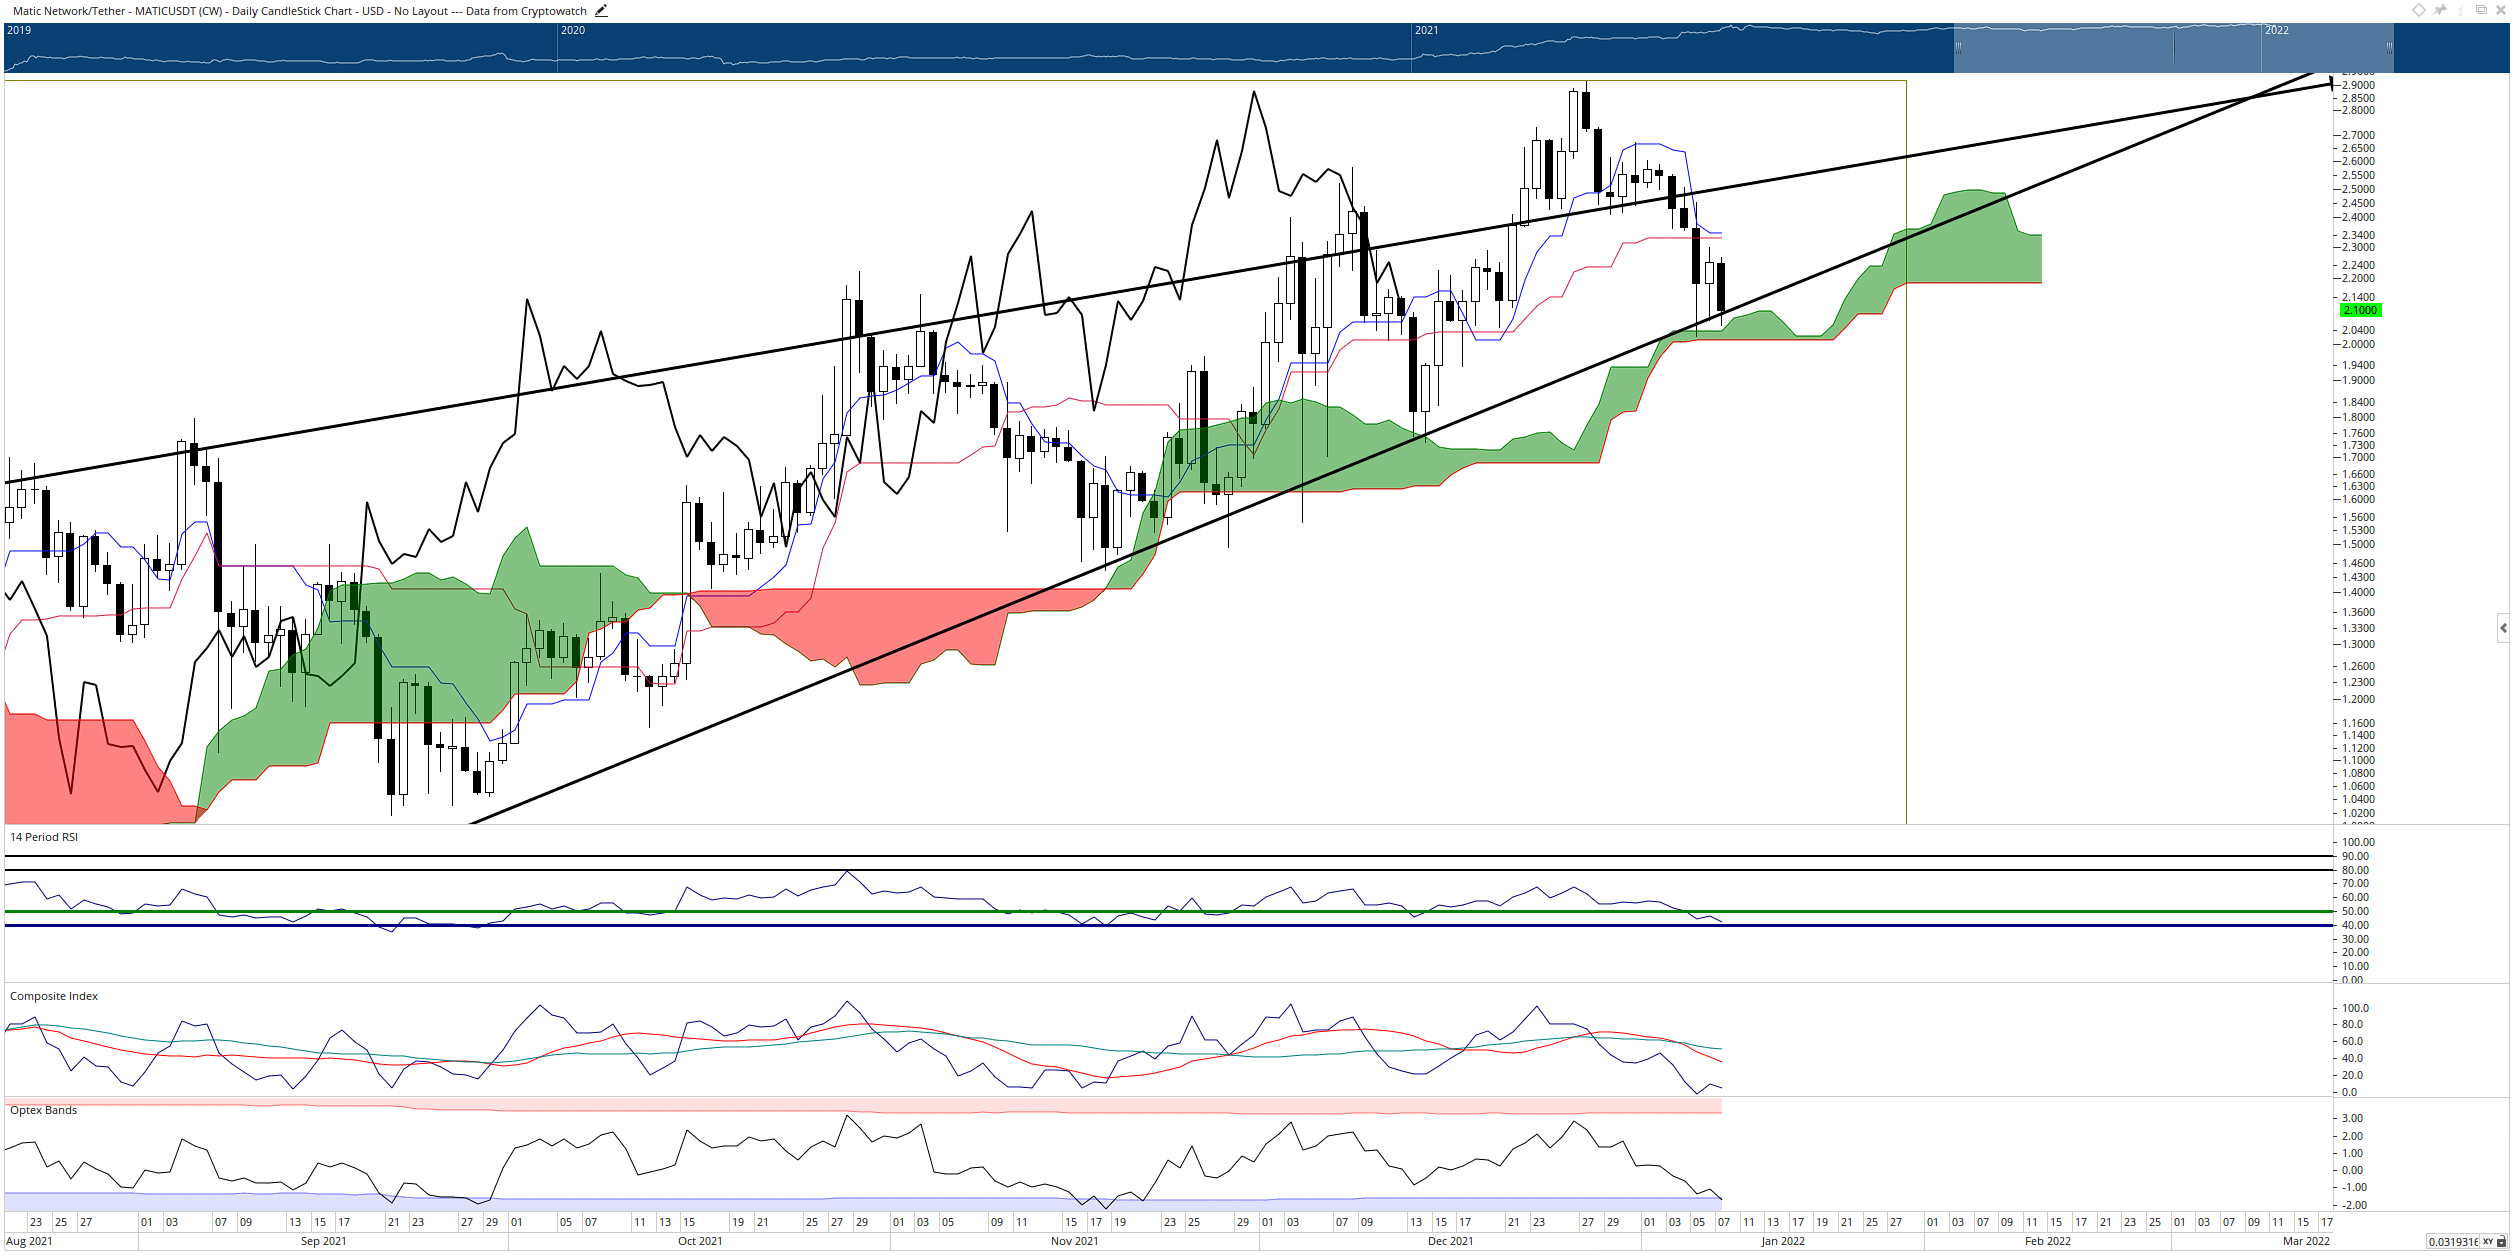
MATIC/USD Daily Ichimoku Chart
The daily chart shows that MATIC price is at a strong confluence zone of support with the lower trendline of the rising wedge and the Cloud. Additionally, the Relative Strength Index is on top of the last oversold level in a bull market (40), while the Optex Bands oscillator hits extreme oversold conditions. Therefore, a marked bull return higher is very probable.
Author

Jonathan Morgan
Independent Analyst
Jonathan has been working as an Independent future, forex, and cryptocurrency trader and analyst for 8 years. He also has been writing for the past 5 years.


