MATIC price prediction: Polygon flashes bearish chart pattern projecting 32% decline [Video]
- MATIC price could be headed for a 32% fall after a bearish chart pattern emerged.
- If Polygon slices below $2.34, it could spell trouble for the bulls.
- The bears target $1.64 next but lower prices are not expected.
![MATIC price prediction: Polygon flashes bearish chart pattern projecting 32% decline [Video]](https://editorial.fxstreet.com/images/Markets/Currencies/Cryptocurrencies/Polygon/polygon-200x200-637526942732422088.jpg)
MATIC price is at the cliff of a 32% descent as Polygon is nearing a critical support line. The prevailing chart pattern suggests that the bears are planning a significant sell-off toward $1.64 if the layer-2 token slices below $2.34.
MATIC bears prepare for slide toward $1.64
MATIC price has formed a rising wedge pattern on the 12-hour chart, suggesting a bearish outlook for the token. The governing technical pattern projects a 32% nosedive toward $1.64 if Polygon breaks below the lower boundary of the prevailing chart pattern at $2.34.
The first line of defense for MATIC price will appear at the 38.2% Fibonacci retracement level at $2.37, coinciding with the 50 twelve-hour Simple Moving Average (SMA).
Before the bears reach the pessimistic target given by the prevailing chart pattern at $1.64, additional support will emerge at the 50% retracement level at $2.20, then at the 100 twelve-hour SMA at $2.11.
Further footholds may appear at the 61.8% Fibonacci retracement level at $2.02, then at the 200 twelve-hour SMA at $1.83. The last line of defense for MATIC price will be uncovered at the 78.6% Fibonacci retracement level at $1.77 before the sellers tag the bearish target at $1.64, coinciding with the support line given by the Momentum Reversal Indicator (MRI).
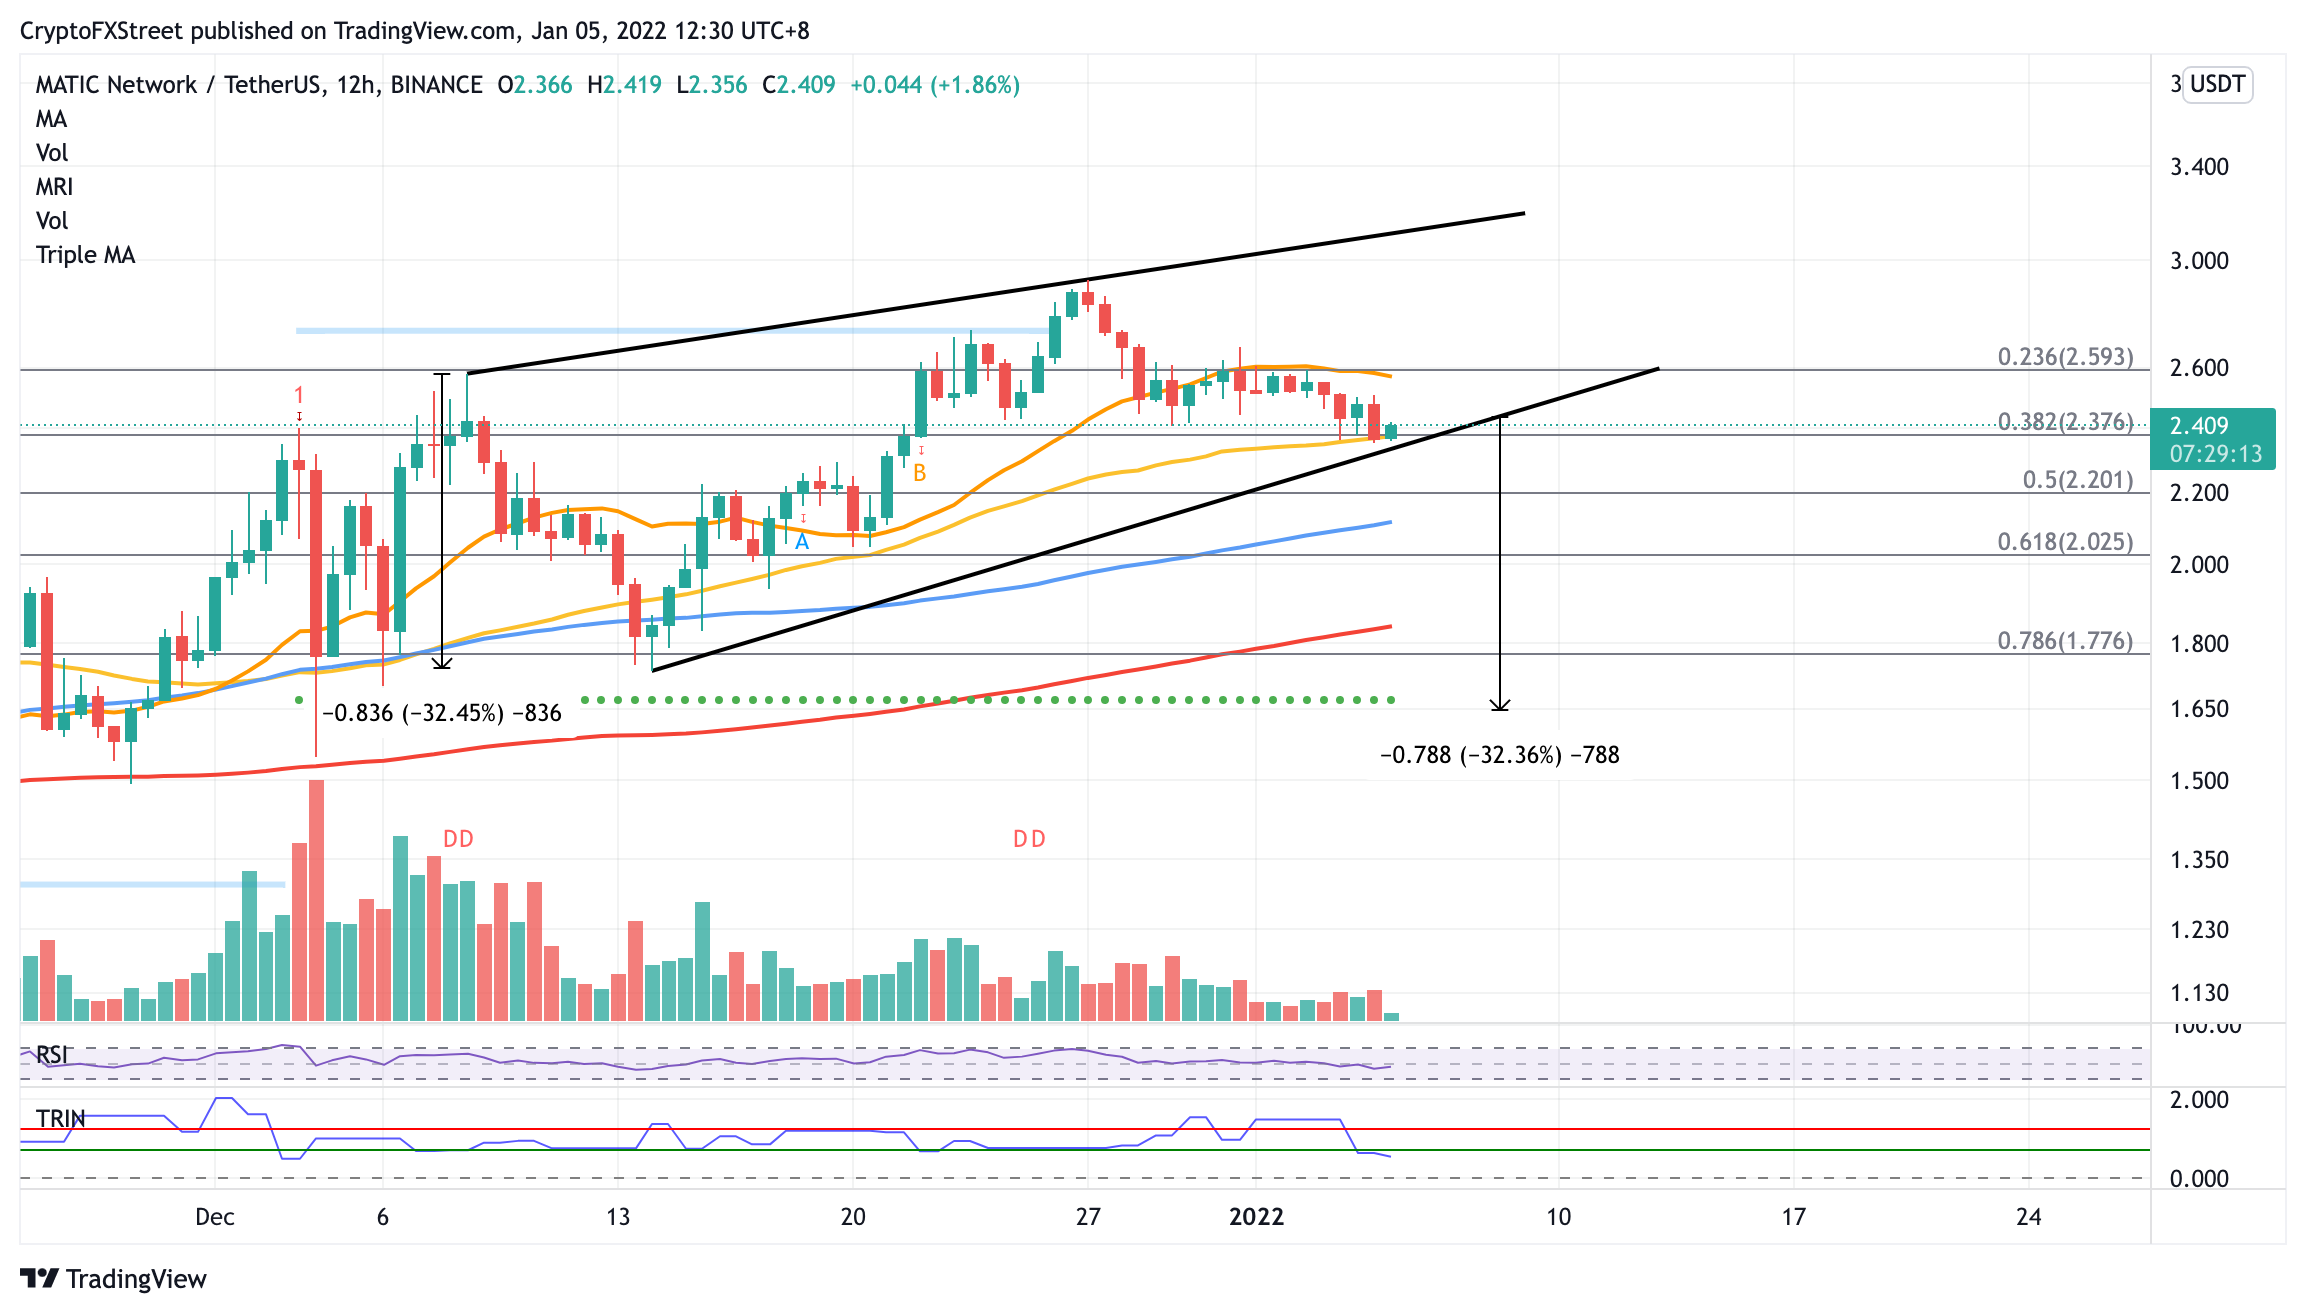
MATIC/USDT 12-hour chart
However, if the bulls manage to turn the narrative around, the first line of resistance will emerge at the 21 twelve-hour SMA at $2.59, which intersects with the 23.6% Fibonacci retracement level.
Additional resistance will appear at the December 31 high at $2.66, before Polygon bulls attempt to challenge the record high at $2.93.
Author

Sarah Tran
Independent Analyst
Sarah has closely followed the growth of blockchain technology and its adoption since 2016.


