|

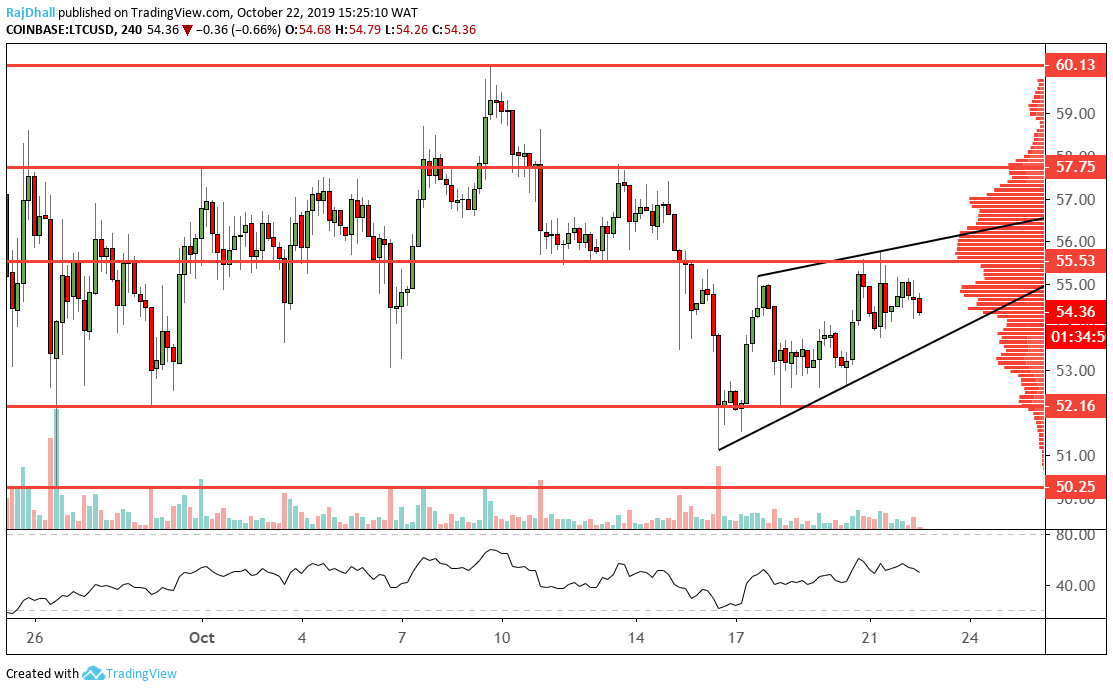
LTC/USD technical analysis: Litecoin rejects 55.00 and moves 0.66% lower

  • The general cryptocurrency sentiment has turned negative today after a good start earlier in the session.
  • Now support levels are in focus for Litecoin after 55.00 was rejected to the upside.

The LTC/USD four-hour chart is showing signs of weakness on Tuesday after bears take control.

There is now a rising wedge formation on the chart and the lower part of the channel could meet the price at around 53.75.

The candle patterns are looking bearish as after the reversal a Doji candle was printed. The current candle is also bearish but has some time to turnaround.

For the bulls, 55.00 proved to be a tough nut to crack. The resistance level held firm as it had done as a support and resistance level in the past.

52.16 is now the next level in focus on the downside but this will only be the case if the bottom of the rising wedge gets breached.

Currently, the volume is heavier on the sell-side and the biggest spike in recent times supported the selling action on 16th October.

The volume profile indicator on the right-hand side of the chart is also showing a bearish picture as the price is currently underneath the peak of the bell curve.

The relative strength index (RSI) indicator has moved above the 50 mid-line but it has just turned lower. 

So it seems, for now, the technical signals are looking weak as we get into the mid-US session we should get a clearer picture.

Litecoin Analysis

LTC/USD

Overview
Today last price54.4405
Today Daily Change-0.3506
Today Daily Change %-0.64
Today daily open54.7911
 
Trends
Daily SMA2055.7972
Daily SMA5062.4773
Daily SMA10073.8287
Daily SMA20087.8014
 
Levels
Previous Daily High55.8225
Previous Daily Low53.8361
Previous Weekly High57.8297
Previous Weekly Low51.1734
Previous Monthly High80.2956
Previous Monthly Low 50.399
Daily Fibonacci 38.2% 54.5949
Daily Fibonacci 61.8%55.0637
Daily Pivot Point S153.8106
Daily Pivot Point S252.8301
Daily Pivot Point S351.8241
Daily Pivot Point R155.7971
Daily Pivot Point R256.803
Daily Pivot Point R357.7835

Author

Rajan Dhall, MSTA

Rajan Dhall is an experienced market analyst, who has been trading professionally since 2007 managing various funds producing exceptional returns.

More from Rajan Dhall, MSTA
Share:

Editor's Picks

Ripple slides to $1.45 as downside risks surge

Ripple edges lower at the time of writing on Tuesday, from the daily open of $1.48, as headwinds persist across the crypto market. A short-term support is emerging at $1.45, but a buildup of bearish positions could further weaken the derivatives market and prolong the correction.

Bitcoin slips below $68,000 as defensive stance limits recovery

Bitcoin edges lower on Tuesday, extending consolidation in a trading range for over ten days. Market conditions remain defensive, with sustainable recovery depending on renewed spot demand, report says.

Crypto Today: Bitcoin, Ethereum, XRP upside looks limited amid deteriorating retail demand

The cryptocurrency market extends weakness with major coins including Bitcoin (BTC), Ethereum (ETH) and Ripple (XRP) trading in sideways price action at the time of writing on Tuesday.

Meme Coins Price Prediction: Bears push Dogecoin, Shiba Inu, Pepe to the ropes

Meme coins, including Dogecoin, Shiba Inu, and Pepe, are under pressure on Tuesday, extending Sunday’s decline. The derivatives data show substantial outflows from DOGE, SHIB, and PEPE futures Open Interest, primarily driven by long-side-skewed liquidations. 

Bitcoin Price Annual Forecast: BTC holds long-term bullish structure heading into 2026

Bitcoin (BTC) is wrapping up 2025 as one of its most eventful years, defined by unprecedented institutional participation, major regulatory developments, and extreme price volatility.

Bitcoin: BTC bears aren’t done yet

Bitcoin (BTC) price slips below $67,000 at the time of writing on Friday, remaining under pressure and extending losses of nearly 5% so far this week.