|

Litecoin technical analysis: LTC/USD went down from $75.65 to $75.15 this Saturday

  • LTC/USD has found resistance on the downward trending line.
  • The hourly LTC/USD price is currently trending horizontally.

LTC/USD daily chart

fxsoriginal

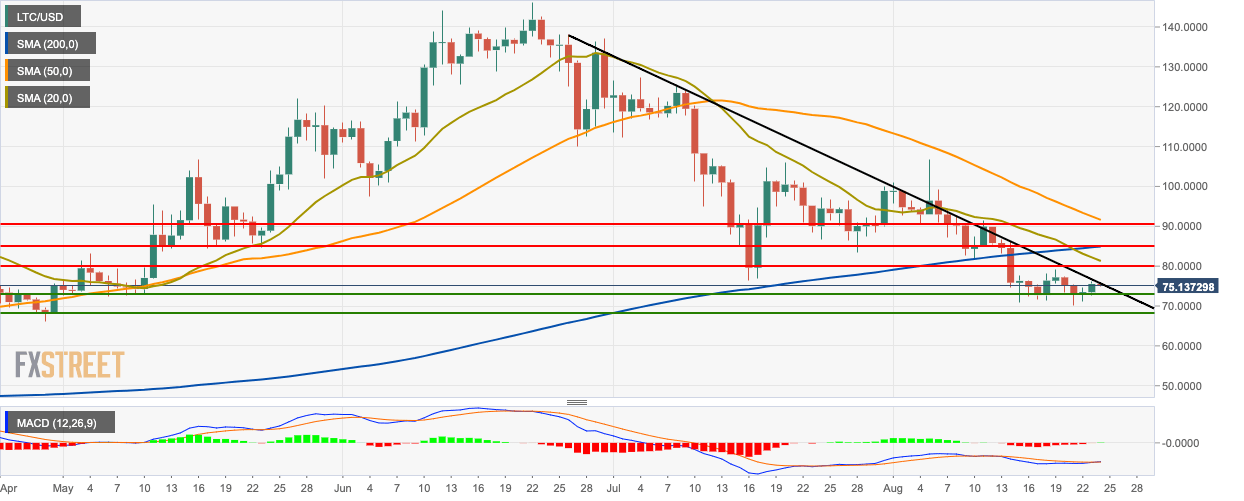
Following a bullish Friday, LTC/USD managed to have a bearish start to Saturday. This Friday, the price of LTC/USD went up from $73.50 to $75.65. Litecoin has gone down to 75.15 so far this Saturday and is facing resistance from the downward trending line. The price is trending below the 200-day simple moving average (SMA 200), SMA 50 and SMA 20 curves. The moving average convergence/divergence (MACD) indicator shows a reversal of market momentum from bearish to bullish.

LTC/USD 4-hour chart

fxsoriginal

The 4-hour LTC/USD price is consolidating in a flag formation. The price is trending above the SMA 50 and SMA 20 curves and is below the SMA 200 curve. The 20-day Bollinger jaw is widening a little bit, which hints at increasing market volatility. The Elliott oscillator has had four straight bullish sessions.

LTC/USD hourly chart

fxsoriginal

The hourly LTC/USD is trending horizontally around the $75.25 resistance line. The price has spiked above the green Ichimoku cloud. The relative strength index (RSI) indicator was trending right next to the overbought zone and then dipped down to 61.

Key Levels

LTC/USD

Overview
Today last price75.14
Today Daily Change-0.3854
Today Daily Change %-0.51
Today daily open75.5254
 
Trends
Daily SMA2082.1848
Daily SMA5092.4926
Daily SMA100105.1278
Daily SMA20084.6756
Levels
Previous Daily High76.0343
Previous Daily Low72.5179
Previous Weekly High79.0884
Previous Weekly Low70.0674
Previous Monthly High127.2049
Previous Monthly Low76.4679
Daily Fibonacci 38.2%74.691
Daily Fibonacci 61.8%73.8611
Daily Pivot Point S173.3508
Daily Pivot Point S271.1762
Daily Pivot Point S369.8344
Daily Pivot Point R176.8671
Daily Pivot Point R278.2089
Daily Pivot Point R380.3835


Author

Rajarshi Mitra

Rajarshi Mitra

Independent Analyst

Rajarshi entered the blockchain space in 2016. He is a blockchain researcher who has worked for Blockgeeks and has done research work for several ICOs. He gets regularly invited to give talks on the blockchain technology and cryptocurrencies.

More from Rajarshi Mitra
Share:

Editor's Picks

Ripple slides to $1.45 as downside risks surge

Ripple edges lower at the time of writing on Tuesday, from the daily open of $1.48, as headwinds persist across the crypto market. A short-term support is emerging at $1.45, but a buildup of bearish positions could further weaken the derivatives market and prolong the correction.

Bitcoin slips below $68,000 as defensive stance limits recovery

Bitcoin edges lower on Tuesday, extending consolidation in a trading range for over ten days. Market conditions remain defensive, with sustainable recovery depending on renewed spot demand, report says.

Crypto Today: Bitcoin, Ethereum, XRP upside looks limited amid deteriorating retail demand

The cryptocurrency market extends weakness with major coins including Bitcoin (BTC), Ethereum (ETH) and Ripple (XRP) trading in sideways price action at the time of writing on Tuesday.

Meme Coins Price Prediction: Bears push Dogecoin, Shiba Inu, Pepe to the ropes

Meme coins, including Dogecoin, Shiba Inu, and Pepe, are under pressure on Tuesday, extending Sunday’s decline. The derivatives data show substantial outflows from DOGE, SHIB, and PEPE futures Open Interest, primarily driven by long-side-skewed liquidations. 

Bitcoin Price Annual Forecast: BTC holds long-term bullish structure heading into 2026

Bitcoin (BTC) is wrapping up 2025 as one of its most eventful years, defined by unprecedented institutional participation, major regulatory developments, and extreme price volatility.

Bitcoin: BTC bears aren’t done yet

Bitcoin (BTC) price slips below $67,000 at the time of writing on Friday, remaining under pressure and extending losses of nearly 5% so far this week.