|

Litecoin technical analysis: LTC/USD market sentiment remains bearish as short-term bullish comeback gets squashed

  • Daily LTC/USD chart found resistance at the downward trending line.
  • The four-hour chart is trending in a downwards channel formation.

LTC/USD daily chart

fxsoriginal

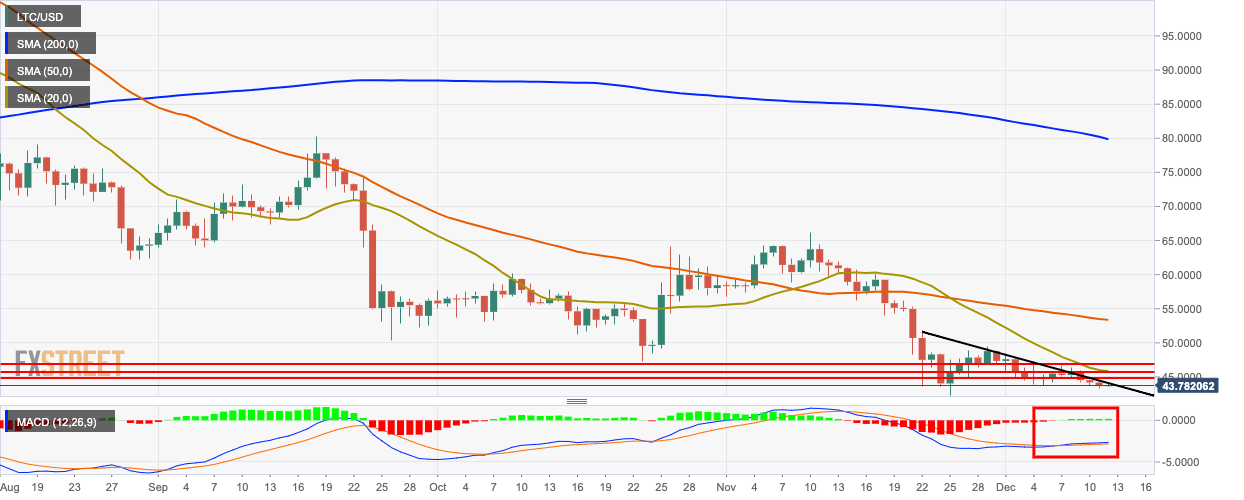
LTC/USD bears came out on top for three days in a row. The price dropped from $44.25 to $43.70 this Wednesday and is floating below the 200-day Simple Moving Average (SMA 200), SMA 50 and SMA 20 curves. The bulls will need to break above the resistance provided by the downward trending line. The Moving Average Convergence/Divergence (MACD) indicates sustained bullish momentum.

LTC/USD four-hour chart

fxsoriginal

The four-hour market is trending in a downward channel formation and is floating below the SMA 20 and SMA 50 curves. The price found support at the $43.55 and went up slightly to $43.70. The Elliott Oscillator has had four straight red sessions.

LTC/USD hourly chart

fxsoriginal

The hourly chart shows us that the bulls were attempting a comeback before the bears squashed it and took the price below the channel formation. The SMA 20, SMA 50 and SMA 200 curves are floating above the market. The Relative Strength Index (RSI) indicator dropped to 39 from 43.75.

Key Levels

LTC/USD

Overview
Today last price43.7117
Today Daily Change0.0290
Today Daily Change %0.07
Today daily open43.6827
 
Trends
Daily SMA2046.0062
Daily SMA5053.3935
Daily SMA10058.0317
Daily SMA20080.8223
 
Levels
Previous Daily High44.462
Previous Daily Low43.285
Previous Weekly High48.5063
Previous Weekly Low43.8063
Previous Monthly High66.2492
Previous Monthly Low42.351
Daily Fibonacci 38.2%43.7346
Daily Fibonacci 61.8%44.0124
Daily Pivot Point S143.1578
Daily Pivot Point S242.6329
Daily Pivot Point S341.9808
Daily Pivot Point R144.3348
Daily Pivot Point R244.9869
Daily Pivot Point R345.5118


Author

Rajarshi Mitra

Rajarshi Mitra

Independent Analyst

Rajarshi entered the blockchain space in 2016. He is a blockchain researcher who has worked for Blockgeeks and has done research work for several ICOs. He gets regularly invited to give talks on the blockchain technology and cryptocurrencies.

More from Rajarshi Mitra
Share:

Editor's Picks

Stellar mixed sentiment caps recovery

Stellar price remains under pressure, trading at $0.170 on Tuesday after failing to close above the key resistance on Sunday. The derivatives metric supports the bearish sentiment, with XLM’s short bets rising among traders and funding rates turning negative.

Jupiter  rises on native SOL staking, TVL rebound

Jupiter edges higher by 3% at press time on Tuesday, approaching the $0.1700 level. The lending protocol announced native staking as collateral, allowing users to borrow against natively staked SOL on certain vaults.

Rocket Pool price extends rally as Saturn One upgrade boosts sentiment

Rocket Pool price extends its gains, trading above $2.80 on Tuesday after rallying over 58% in the previous day. The upcoming Saturn One network upgrade on Wednesday has fueled renewed buying interest.

Pi Network rallies ahead of its first anniversary

Pi Network trades above $0.1800 at the time of writing on Tuesday, recording nearly 5% gains so far. On-chain data indicate that large wallet investors, commonly known as whales, have accumulated approximately 4 million PI tokens over the last 24 hours.

Bitcoin Price Annual Forecast: BTC holds long-term bullish structure heading into 2026

Bitcoin (BTC) is wrapping up 2025 as one of its most eventful years, defined by unprecedented institutional participation, major regulatory developments, and extreme price volatility.

Bitcoin: BTC bears aren’t done yet

Bitcoin (BTC) price slips below $67,000 at the time of writing on Friday, remaining under pressure and extending losses of nearly 5% so far this week.