Litecoin Technical Analysis: LTC/USD key support at $31 must hold
- Litecoin price trading firmly in negative territory on Thursday, down over 3%.
- LTC/USD price action is being supported via the daily time frame by an ascending trend line.

LTC/USD 15-minute chart
- Price action moving to the downside within a steep descending channel/wedge formation.
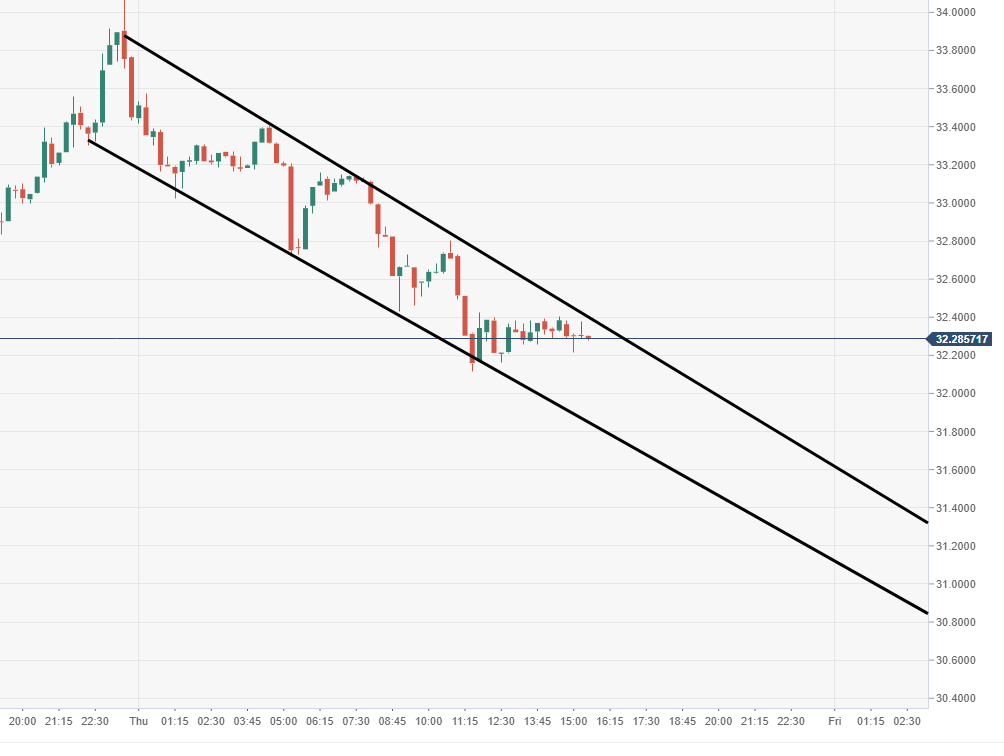
Spot rate: 3840.62
Relative change: -1.65%
High: 33.57
Low: 32.11
Trend: Bearish
Support 1: 32.11, daily pivot point support.
Support 2: 30.79, daily pivot point support.
Support 3: 29.79, daily pivot point support.
Resistance 1: 34.44, daily pivot point resistance.
Resistance 2: 35.43, daily pivot point resistance.
Resistance 3: 36.76, daily pivot point resistance.
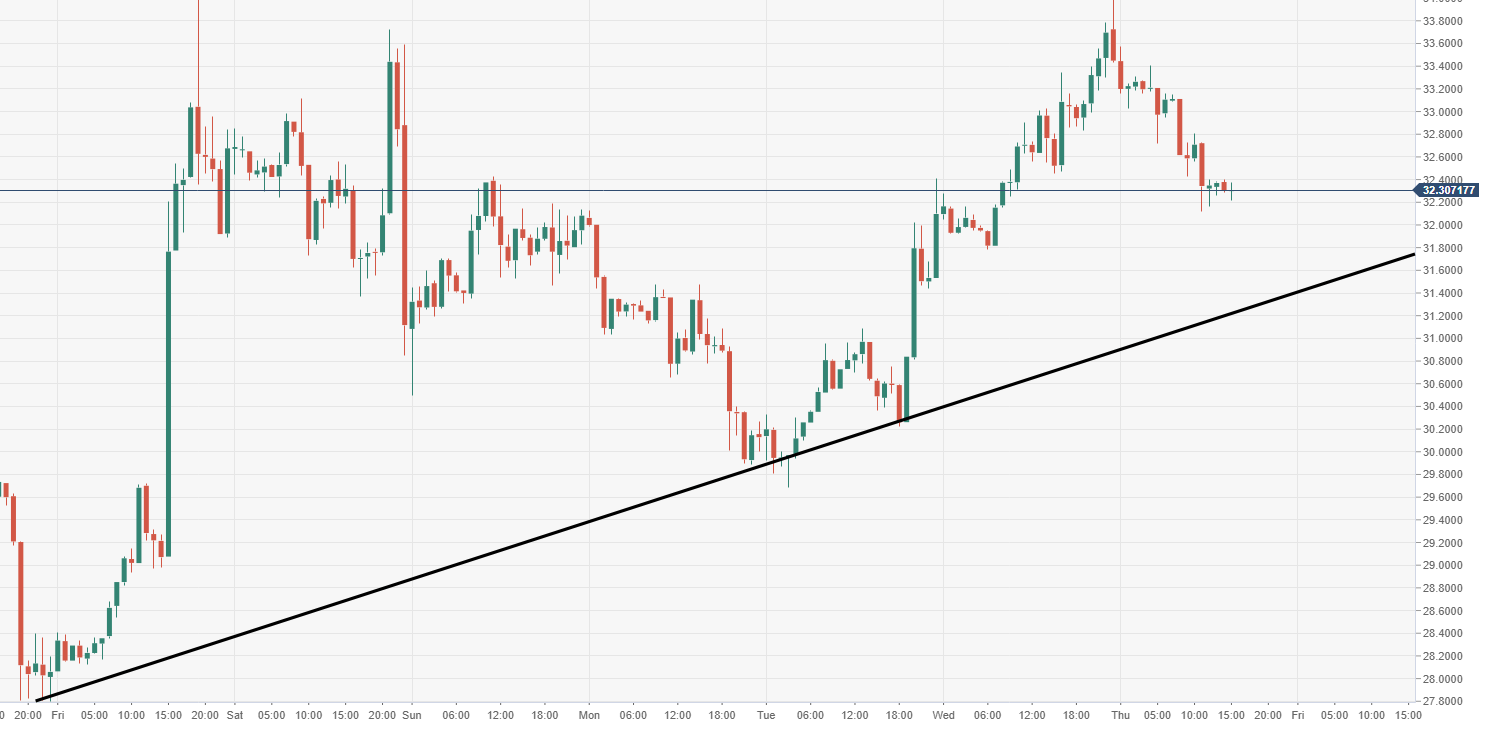
LTC/USD 60-minute chart
- Looking via the shorter time frame, support seen just below, tracking at $31.
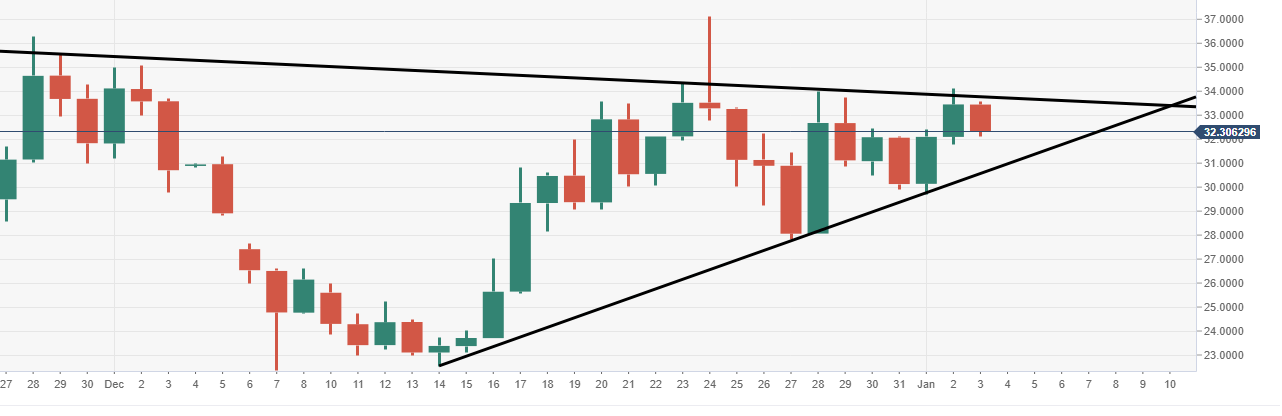
LTC/USD daily chart
- LTC/USD supported by an ascending trend line, this has been running since 16th December.
Author

Ken Chigbo
Independent Analyst
Ken has over 8 years exposure to the financial markets. He started his career as an analyst, covering a variety of asset classes; forex, fixed income, commodities and equities.


