Litecoin Technical Analysis: LTC/USD forms a bull flag pattern, paving the way for a near-term spike higher, bulls appear as ready to charge
- Litecoin on Monday seen up over 2%, after maintaining some upside momentum, following the decent bounce in the previous session.
- A bull flag pattern is seen on the 30-minute time frame, which could see the price breakout back to $90+.

LTC/USD 30-minute chart
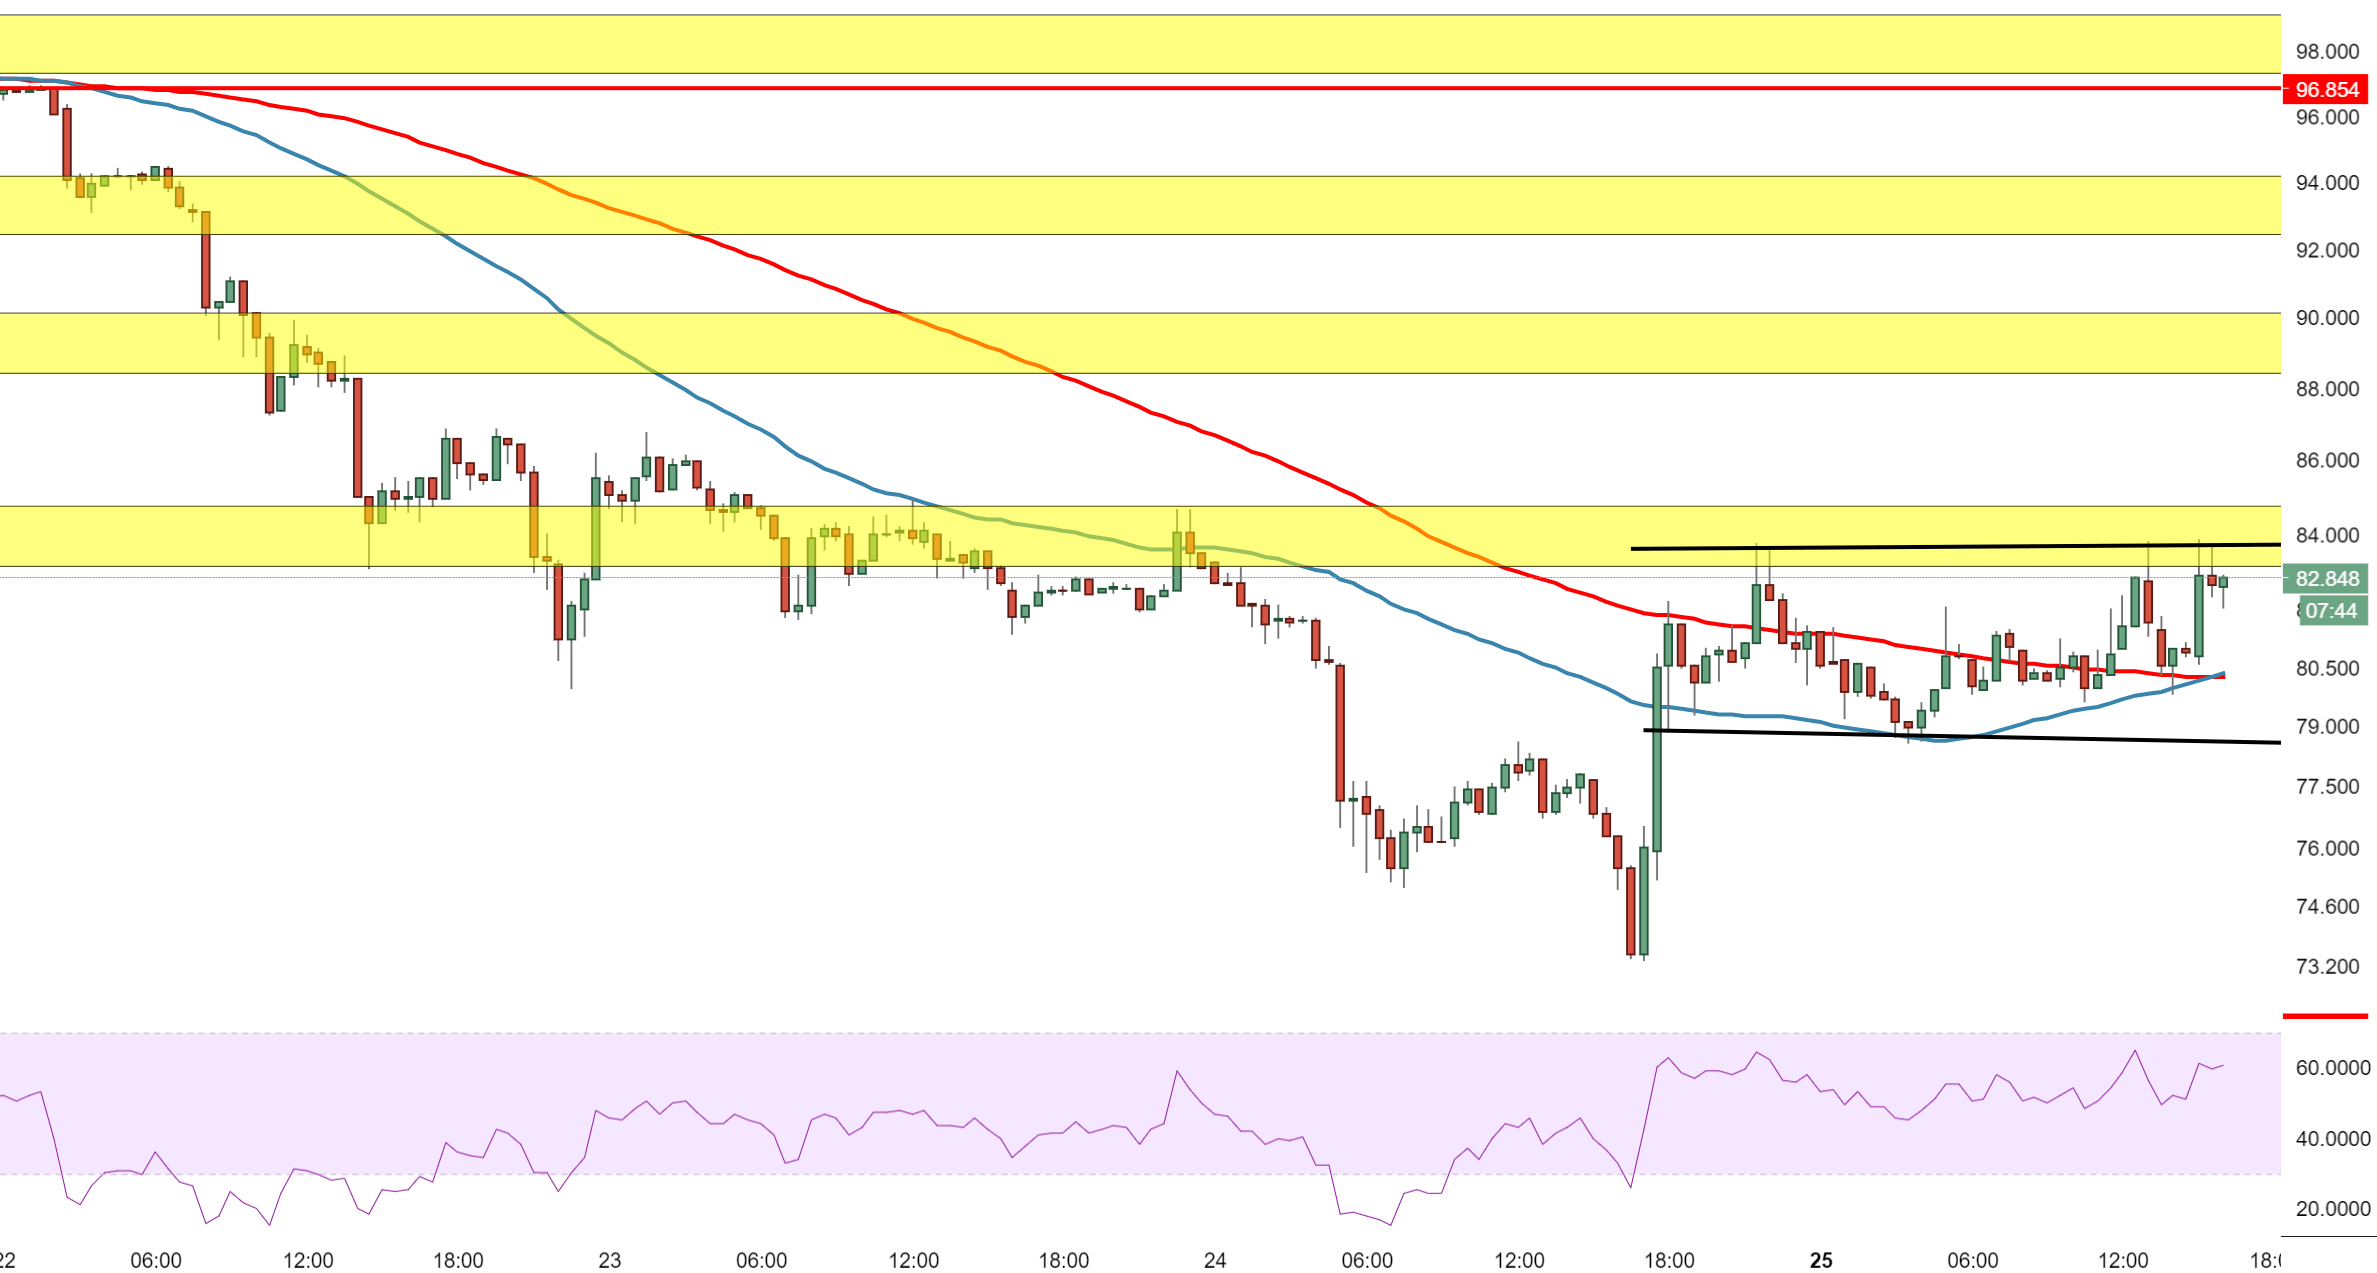
Spot rate: 82.33
Relative change: +2.14%
High: 83.84
Low: 78.55
Trend: Bullish/Neutral
Resistance 1: 83.70, upper trend line of bull flag.
Resistance 2: 86.70, (resistance on 30-minute chart).
Resistance 3: 88.35, supply zone entry.
Support 1: 80.25, 50 & 100MAs.
Support 2: 78.68, lower trend line of bull flag.
Support 3: 75.06, (support on 30-minute chart).
Author

Ken Chigbo
Independent Analyst
Ken has over 8 years exposure to the financial markets. He started his career as an analyst, covering a variety of asset classes; forex, fixed income, commodities and equities.


