|

Litecoin Technical Analysis: LTC/USD can't escape the deadly technical structure

  • Litecoin price on Friday seen holding gains of over 2% in the latter part of the session. 
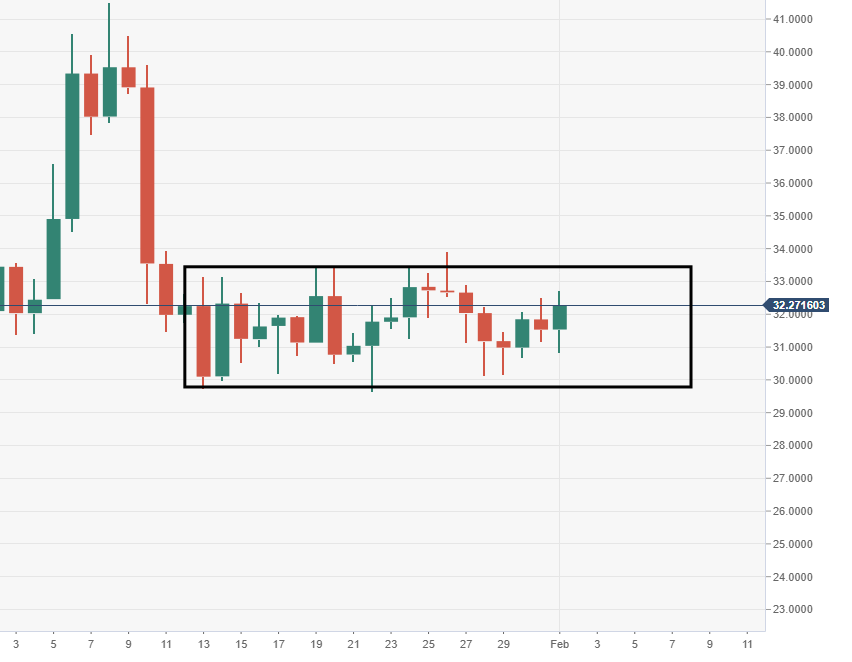
  • LTC/USD remains stuck within stubborn 3-week trading range, not enough commitment. 
  • The daily chart view could be eyed as a bearish flag formation. 

LTC/USD 15-minute chart

  • LTC/USD slips out from an ascending channel formation, after price hit near-term resistance. 
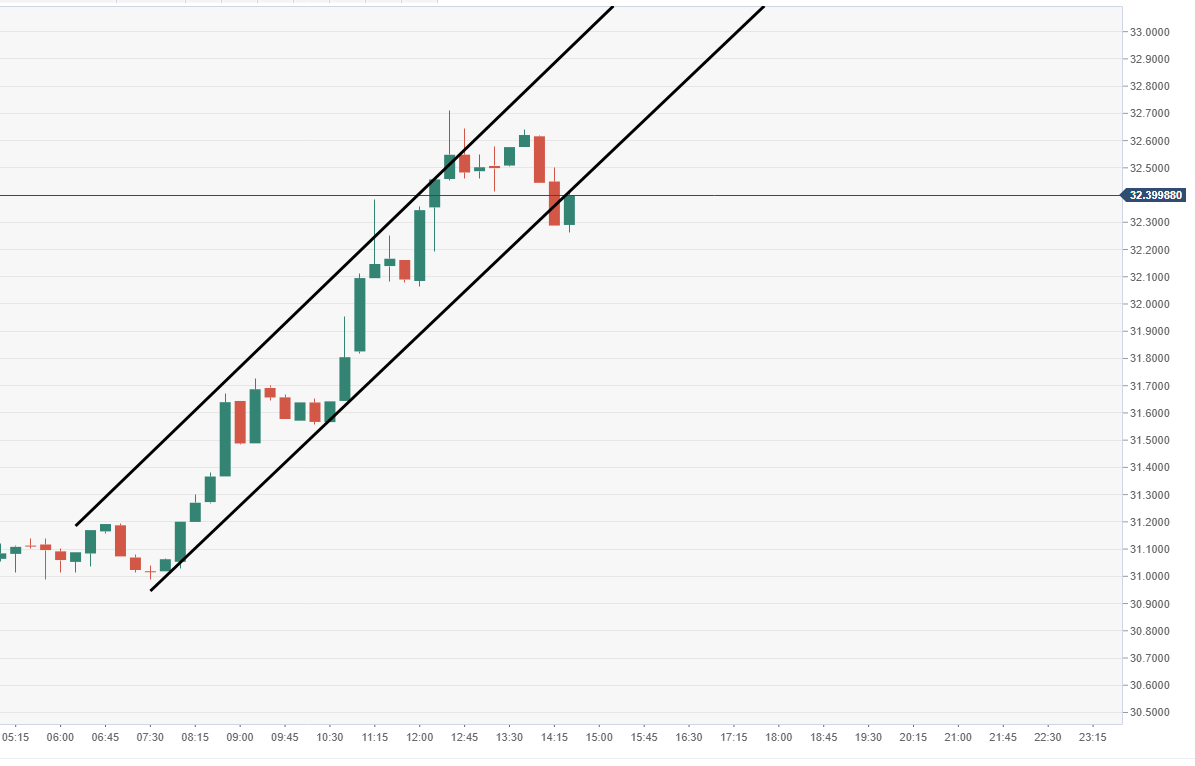
Spot rate:               32.27

Relative change:    +2.35%

High:                       32.71

Low:                        30.83

Trend:                      Bearish

Support 1:               30.97, daily pivot point support.

Support 2:               30.41, daily pivot point support.

Support 3:               29.64, daily pivot point support.

Resistance 1:          32.29, daily pivot point resistance.

Resistance 2:          33.06, daily pivot point resistance.

Resistance 3:          33.62, daily pivot point resistance.

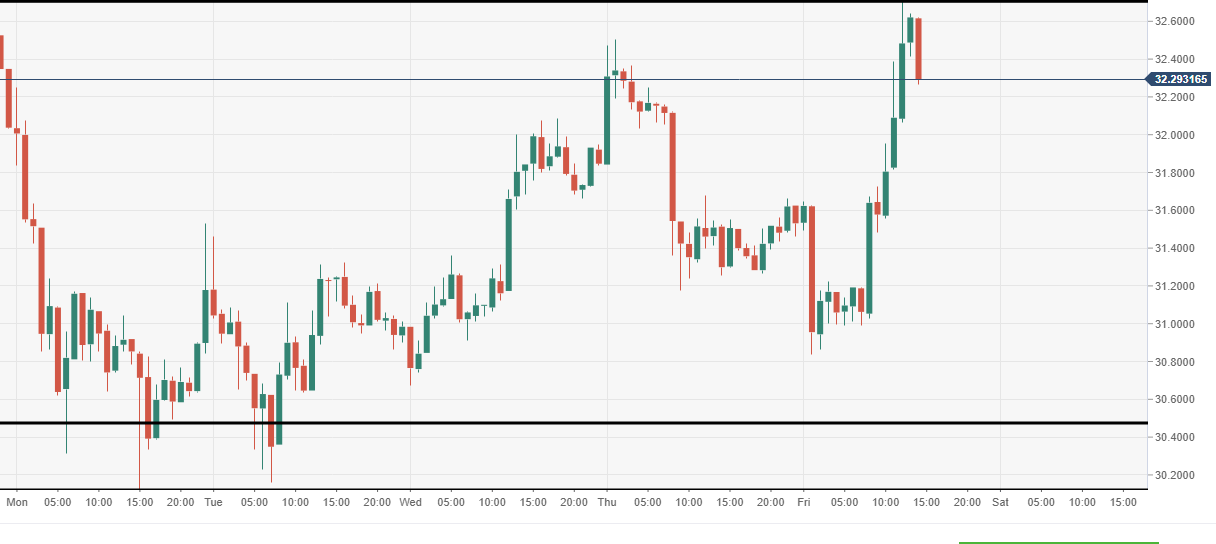
LTC/USD 60-minute chart

  • Price ran into sellers heading into the $33 price area, a known supply zone. 

LTC/USD daily chart

  • Bears can be seen gunning towards that big key area of demand, near-term initially this can be seen $0.3000-0.2800. 

Author

Ken Chigbo

Ken Chigbo

Independent Analyst

Ken has over 8 years exposure to the financial markets. He started his career as an analyst, covering a variety of asset classes; forex, fixed income, commodities and equities.

More from Ken Chigbo
Share:

Editor's Picks

Bitcoin, Ethereum and Ripple consolidate after massive sell-off

Bitcoin, Ethereum, and Ripple prices consolidated on Monday after correcting by nearly 9%, 8%, and 10% in the previous week, respectively. BTC is hovering around $70,000, while ETH and XRP are facing rejection at key levels. Traders should be cautious: despite recent stabilization, upside recovery for these top three cryptocurrencies is capped as the broader trend remains bearish.

Ethereum: Trend Research capitulates, BitMine's Thomas Lee sees a V-shaped recovery

Ethereum had one of its sharpest historic declines over the past 10 days, shedding 40% of its value and briefly sliding below $2,000. The dip also saw ETH move below its realized price, or the average cost basis of investors — an occurrence that has historically accelerated selling pressure as investors cut losses.

Why Bitcoin and top cryptos are falling: Bitwise

The crypto market crash since October isn't down to a single factor but a combination of several, according to Bitwise CIO Matt Hougan. In a note to investors on Friday, Hougan outlined six key factors that potentially contributed to the crash that pushed down nearly every top crypto by more than 50% from prices seen over four months ago.

XRP recovery gains momentum despite retail market decline

Ripple is accelerating its recovery, trading above $1.36 at the time of writing on Friday, as investors adjust their positions following a turbulent week in the broader crypto market. The remittance token is up over 21% from its intraday low of $1.12.

Bitcoin Price Annual Forecast: BTC holds long-term bullish structure heading into 2026

Bitcoin (BTC) is wrapping up 2025 as one of its most eventful years, defined by unprecedented institutional participation, major regulatory developments, and extreme price volatility.

Bitcoin: The worst may be behind us

Bitcoin (BTC) price recovers slightly, trading at $65,000 at the time of writing on Friday, after reaching a low of $60,000 during the early Asian trading session. The Crypto King remained under pressure so far this week, posting three consecutive weeks of losses exceeding 30%.