|

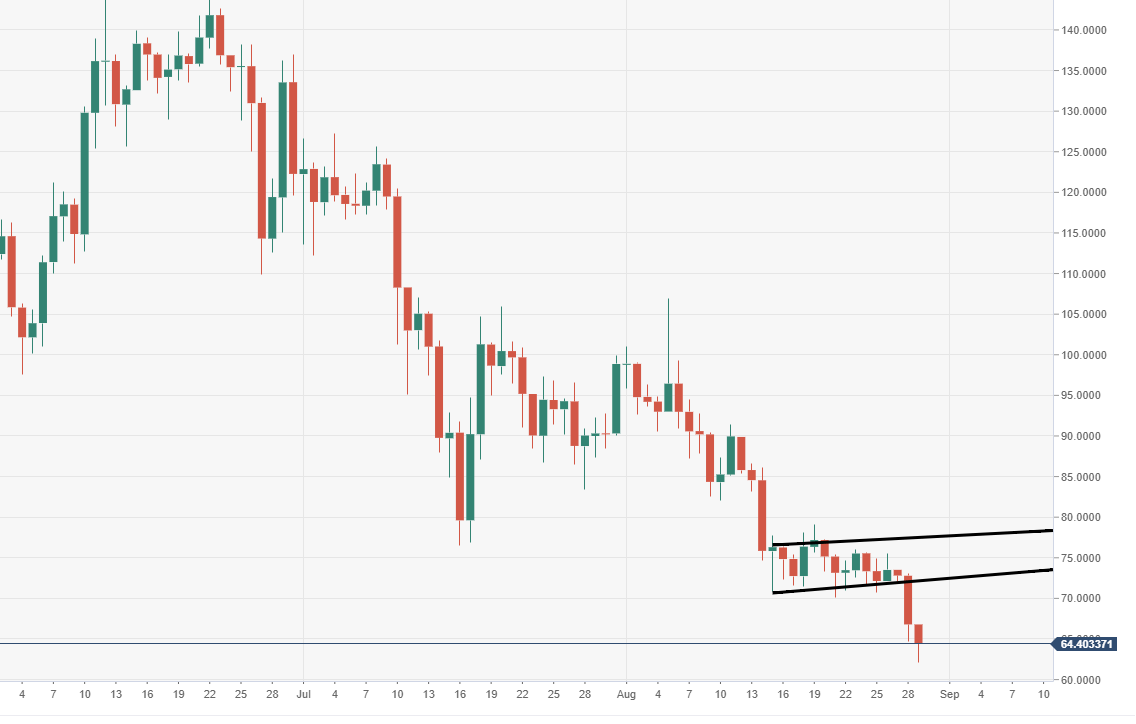
Litecoin technical analysis: LTC/USD big $70 support barrier breached

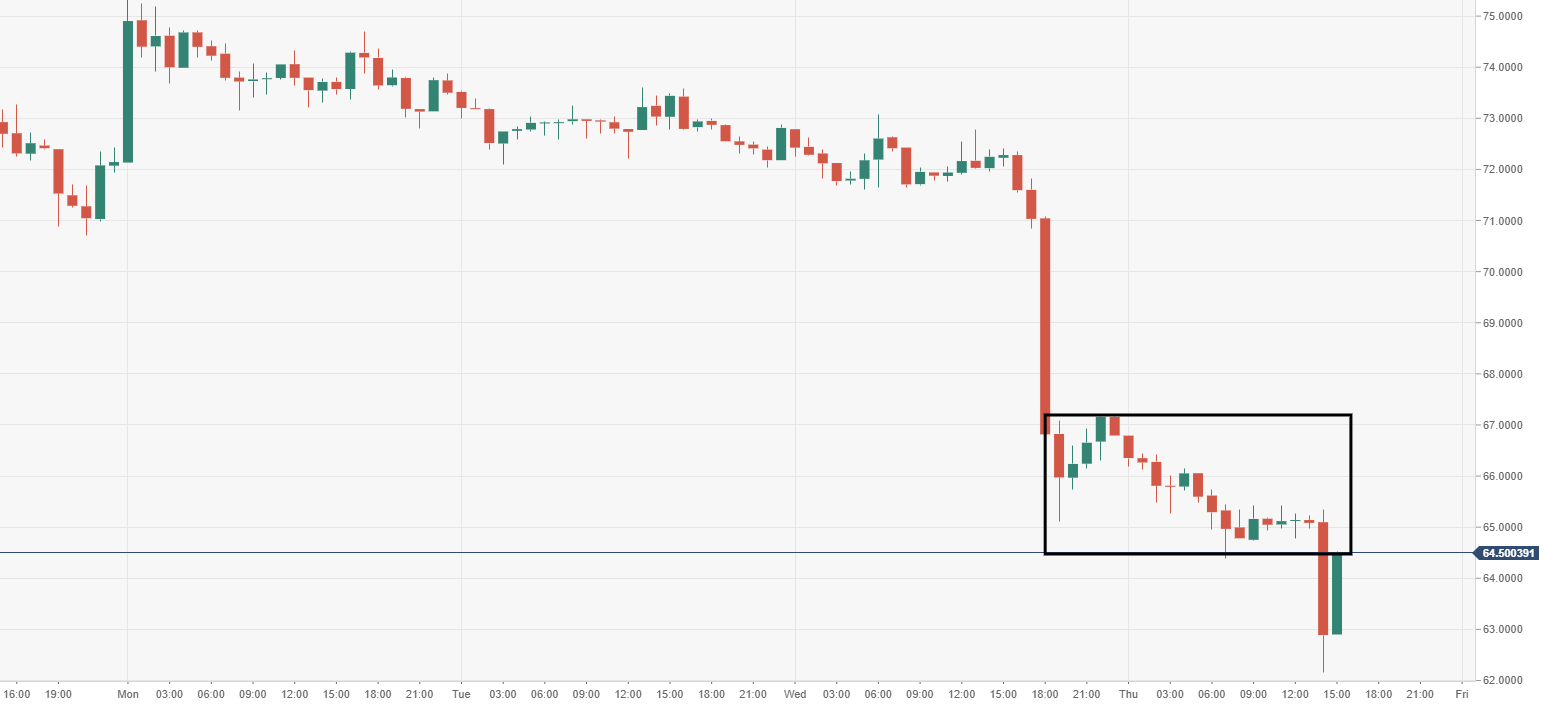
  • Litecoin price on Thursday is trading in negative territory by 4.25%. It is one of the under-performers across the larger altcoins.
  • LTC/USD smashed out from a bearish flag formation, opening door to further downside pressure.
  • Critical daily support at $70 was broken, keeping the bears in control. 

Spot rate:                  64.13

Relative change:      -3.55%

High:                         66.80

Low:                          62.16

LTC/USD

Overview
Today last price64.3642
Today Daily Change-2.4294
Today Daily Change %-3.64
Today daily open66.7936
 
Trends
Daily SMA2076.9556
Daily SMA5087.6627
Daily SMA100104.1243
Daily SMA20085.5821
Levels
Previous Daily High73.066
Previous Daily Low64.6314
Previous Weekly High79.0884
Previous Weekly Low70.0674
Previous Monthly High127.2049
Previous Monthly Low76.4679
Daily Fibonacci 38.2%67.8534
Daily Fibonacci 61.8%69.844
Daily Pivot Point S163.2613
Daily Pivot Point S259.729
Daily Pivot Point S354.8266
Daily Pivot Point R171.6959
Daily Pivot Point R276.5983
Daily Pivot Point R380.1306

LTC/USD daily chart

  • Price action remains heavily weighted to the downside, following support breach and flag breakout. 

LTC/USD 60-minute chart

  • Range block breakout is seen via the 60-minute chart view, retest in play. 

Author

Ken Chigbo

Ken Chigbo

Independent Analyst

Ken has over 8 years exposure to the financial markets. He started his career as an analyst, covering a variety of asset classes; forex, fixed income, commodities and equities.

More from Ken Chigbo
Share:

Editor's Picks

XRP sell-off deepens amid weak retail interest, risk-off sentiment

Ripple (XRP) is edging lower around $1.36 at the time of writing on Wednesday, weighed down by low retail interest and macroeconomic uncertainty, which is accelerating risk-off sentiment.

Crypto Today: Bitcoin, Ethereum, XRP extend sell-off amid negative funding rates 

Bitcoin is down 15% in February and looks poised to extend its losses toward the yearly low of $60,000. Ethereum and Ripple are following in Bitcoin's footsteps, weighed down by a weak derivatives market. 

Hyperliquid tests key support as sell-side pressure intensifies

Hyerliquid (HYPE) drops to its 50-day Exponential Moving Average (EMA) at $28.85 at the time of writing on Wednesday, extending a decline of roughly 10% so far this week. 

Stellar Price Forecast: XLM risks revisiting $0.136 as sell-off continues

Stellar is trading below $0.160 at the time of writing on Wednesday, extending its correction for the fifth consecutive day. The bearish price action is further supported by rising short bets and declining Open Interest in the derivatives market. 

Bitcoin Price Annual Forecast: BTC holds long-term bullish structure heading into 2026

Bitcoin (BTC) is wrapping up 2025 as one of its most eventful years, defined by unprecedented institutional participation, major regulatory developments, and extreme price volatility.

Bitcoin: The worst may be behind us

Bitcoin (BTC) price recovers slightly, trading at $65,000 at the time of writing on Friday, after reaching a low of $60,000 during the early Asian trading session. The Crypto King remained under pressure so far this week, posting three consecutive weeks of losses exceeding 30%.