Litecoin Price: Two reasons why a $100 LTC is not coming anytime soon
- Litecoin price shows a bearish divergence developing on the daily timeframe, hinting at an incoming sell-off.
- On-chain metrics reveal that 22% of LTC holders are profitable, further depicting the shorter-term bearish outlook.
- A breakdown of the $55.23 level will create a lower low, invalidating the longer-term bullish outlook.

Litecoin price embarked on an incredible rally after the FTX-induced crash bottomed on November 9. Due to the explosive moves, many investors are in profit. However, a minor retracement might be necessary for further extension of this move.
Litecoin price needs to cool down
Litecoin price appreciated by 75% in two weeks, starting November 9. This massive rally seems to be experiencing a lack of bullish momentum, pausing its uptrend. As LTC bounces off the $73.10 support level, investors need to consider two things - a minor retracement or a trend continuation.
While the latter is possible under strict conditions, the former seems more likely to occur for two reasons.
The bearish divergence developed between November 6 and 23’s higher highs and the Relative Strength Index’s (RSI) lower lows in the same period. This discrepancy hints that the momentum is waning, but the price increases due to inertia. However, this uptick in Litecoin price is unlikely to sustain forever, so market participants must prepare for a trend reversal.
Hence, a breakdown of the $73.10 support floor will likely see Litecoin price revisit the midpoint of the 75% upswing at $65.63. A sweep of the $61.30 and $58.24 levels might occur in some cases.
Traders should expect a 15% to 24% downswing for LTC. This pullback, however, does not indicate the end of the uptrend. On the contrary, a quick recovery above $65.63 will mean that the bulls are still in control.
In such a case, investors can expect Litecoin price to take off from $65.63 and retest the $96.30 hurdle, bringing the total gain to 47%.
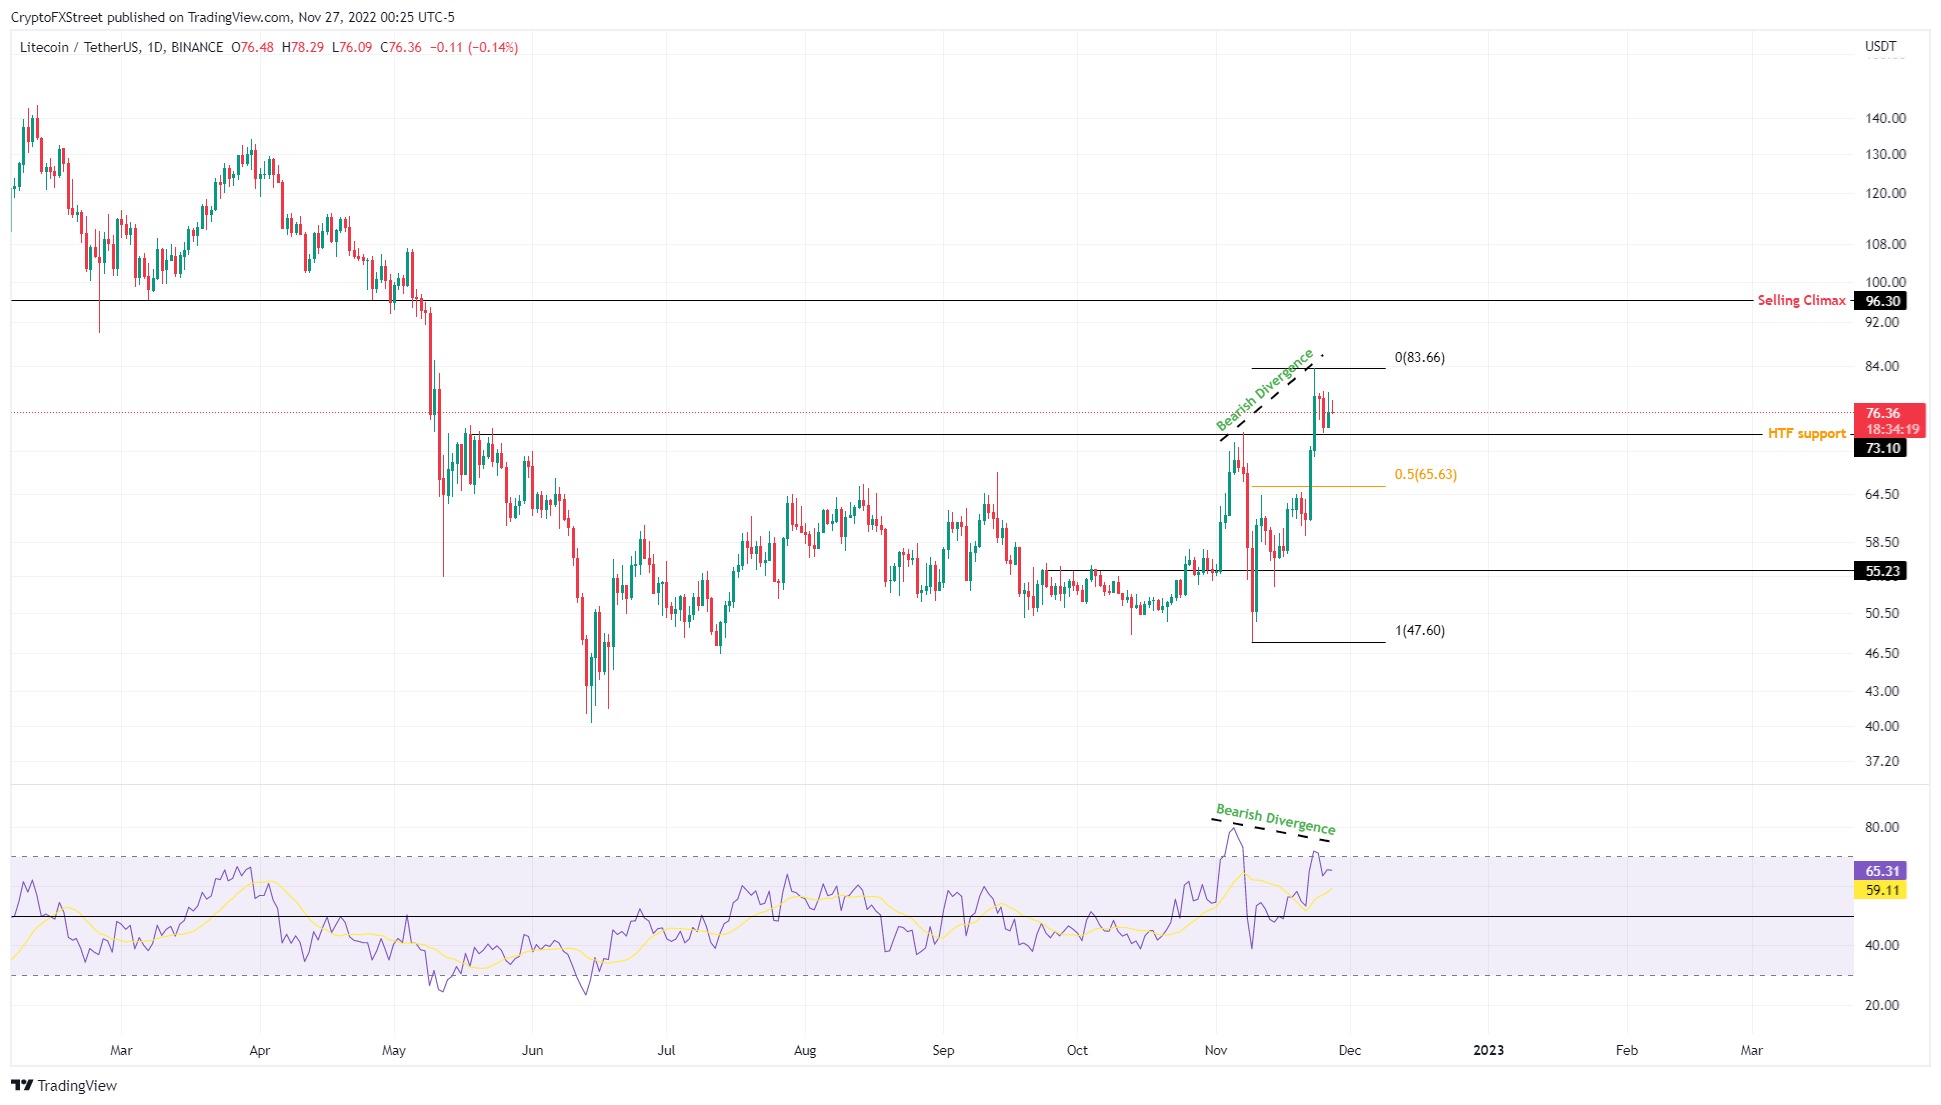
LTC/USDT 1-day chart
Further adding credence to the possibility of a downtrend is the 30-day Market Value to Realized Value (MVRV) indicator. This on-chain metric determines the average profit/loss of investors that purchased LTC over the past month.
Currently, this index is hovering around 22%, suggesting that the average profit of all the investors that purchased LTC in the last month is 22%. If these holders decide to book profit, it could add selling pressure to the mix and trigger a correction.
 [10.57.20, 27 Nov, 2022]-638051316455989393.png)
LTC 30-day MVRV
While things are looking bearish in the short term, the long-term picture of Litecoin price is looking good, with LTC potentially trying to revisit $100. However, if the pullback fails to recover above $65.63 and produces a daily candlestick close below the $55.23 level, it will create a lower low and invalidate the bullish outlook.
Such a development could see Litecoin price crash by 15% and retest the $47.60 level.
Here's how Bitcoin price moves could affect Litecoin price
Author

Akash Girimath
FXStreet
Akash Girimath is a Mechanical Engineer interested in the chaos of the financial markets. Trying to make sense of this convoluted yet fascinating space, he switched his engineering job to become a crypto reporter and analyst.


