Litecoin price screams buy as LTC hashrate climbs
- Litecoin price confirms a bullish outlook bolstered by a symmetrical triangle breakout.
- Litecoin's hashrate spikes to 536.70TH/s amidst improved investor and miner confidence in the network.
- A supply area at $71.05 could poke holes in LTC's bullish outlook.

Litecoin price prepares to usher in the weekend in style as it climbs the ladder hoping to tag $83.83. Most technical indicators flipped bullish when LTC rebounded from support at $50.50. A subsequent move past the sellers’ congestion zone at $56.00 cleared the course for Litecoin bulls to attack key hurdles upstream, as discussed by one of our analysts.
Litecoin price bullish breakout coincides with a spike in LTC's hashrate
Litecoin's hash rate has grown significantly, according to on-chain data graphically presented by CoinWarz. The chart below shows a V-shaped recovery to 536.70TH/s from a recent drop to 440.64TH/s on Monday, October 31.
Hashrate measures the computational power dedicated to mining and validating transactions on the Litecoin blockchain. CoinWarz explains that "the calculation uses the current mining difficulty and the average Litecoin block time between mined blocks versus the defined block time as variables to determine the global Litecoin network hashrate."
-638031677810025546.png)
Litecoin hashrate
Hashrate stats are essential when gauging the safety of the network. Miners deploy more computational power when they believe the crypto project has the potential to grow in value. In other words, the network becomes safer with an increasing hashrate.
How far can Litecoin price go?
Litecoin price finally validated a symmetrical triangle pattern that has been developing since mid-June 2022. As mentioned earlier, support at $50.50 played a crucial role in LTC's northbound move.
Although a symmetrical triangle is usually treated as a neutral pattern, a break above its upper trend line validates a bullish bias. In addition, traders must confirm a spike in positive trading volume before triggering their long positions. In Litecoin's case, the OBV (On-Balance Volume) indicator has been moving to the upside over the last few days, thus reinforcing the bulls' presence in the market.
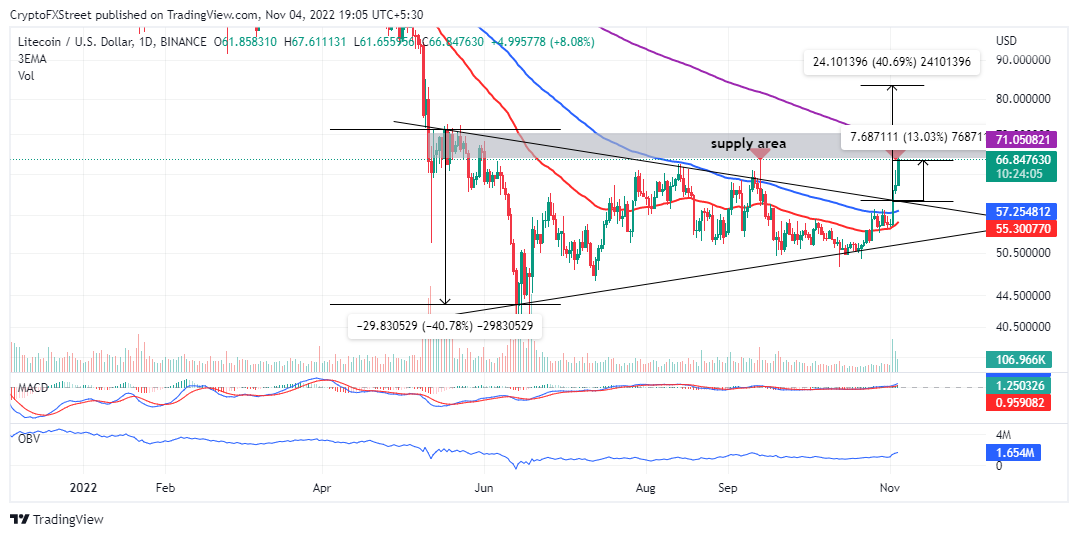
LTCUSD daily chart
In normal market conditions, this bullish breakout in Litecoin price could stretch 40.78% to $83.33. This profit target equals the distance between the widest points of the triangle – extrapolated above LTC's breakout point at $58.97.
Litecoin price has already moved 13.03% above the breakout point and is trading at $66.59 amid a volatility burst - confirmed recently in this analysis. The Moving Average Convergence Divergence indicator (MACD) exhibits a massive bullish bias for LTC as it moves above the mean line (0.00).
On the other hand, resistance presented by the 200-day Exponential Moving Average (EMA) (in purple) at $71.05 could prevent Litecoin price from achieving its bullish potential. Therefore, traders should lock in profits as they go while capitalizing on retracements – for new entries.
Author

John Isige
FXStreet
John Isige is a seasoned cryptocurrency journalist and markets analyst committed to delivering high-quality, actionable insights tailored to traders, investors, and crypto enthusiasts. He enjoys deep dives into emerging Web3 tren




