Litecoin Price Prediction: LTC stalls at a crucial threshold
- Litecoin price fails to take off despite rolling down the runway.
- LTC price is in the process of validating a bearish pennant pattern on its 12-hour chart.
- In the absence of a breakout, Litecoin price could consolidate between $50.50 and $55.72 in the short term.

Litecoin price is trying to find its footing after lifting from support reinforced at $50.50 and topping out at $55.72. This northbound move would have pushed the token out of a narrow-ranging channel. Bulls will have a challenging time dealing with the bear pennant pattern, suggesting that Litecoin is yet to come out of the woods with losses below $50.50 possible.
Litecoin price prepares for another pullback
A bearish pennant pattern started forming after bulls tagged resistance at $56.72. It is worth mentioning that pennants are continuation patterns, just like rectangles. In the case of Litecoin price, the pennant allowed sellers to catch their breath (in consolidation) before pushing for more action to the downside.
With the 50-day SMA (Simple Moving Average –red) limiting movement to the upside, more sellers are likely to seize the opportunity – and bet on an extended down leg. The OBV (On Balance Volume) indicator’s current position indicates an ongoing slump in LTC’s positive trading volume. At the same time, the volume associated with sellers is trending higher, which may confirm the bear pennant pattern breakout.
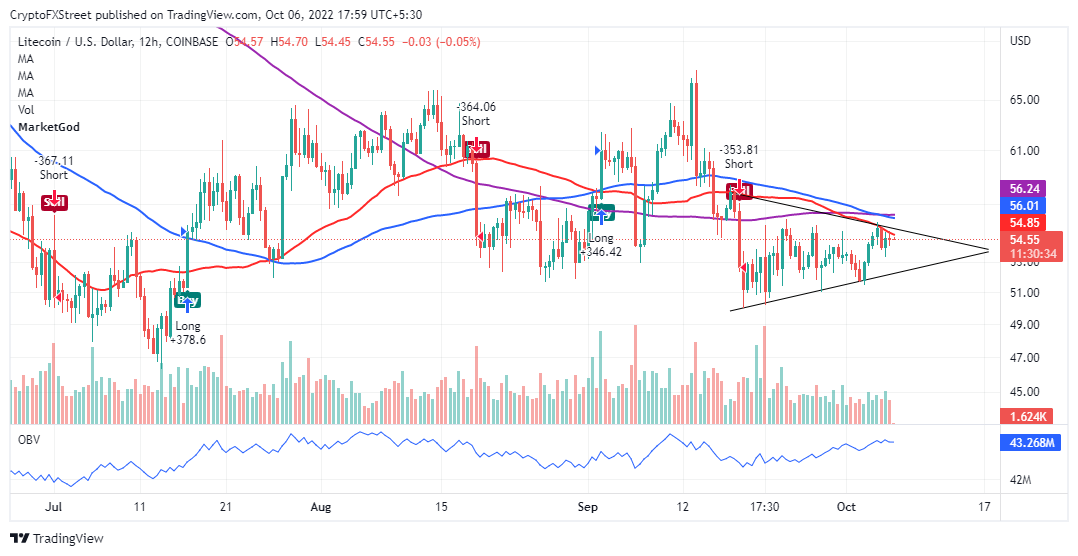
LTC/USD 12-hour chart
According to the IOMAP on-chain model by IntoTheBlock, Litecoin price lost momentum due to the sellers in the region between $54.72 and $56.21. Approximately 387 million addresses purchased 5.94 million LTC tokens in the area.
As Litecoin price climbs the ladder, investors will tend to close their positions, creating overhead pressure. More resistance should be expected in the subsequent range ($56.21 - $57.71). If buyers manage to weaken this seller congestion zone, Litecoin may invalidate the incoming bear breakout for a move higher instead, beyond $60.00.
-638006616428728212.png)
Litecoin IOMAP chart
Short sellers are probably still holding onto positions entered when the MarketGod indicator flashed a sell signal on September 18. Besides, downward pressure may continue building from the 50-day SMA. Key targets to remember south of LTC’s market price are $54.2, $50.50 and $46.00.
Author

John Isige
FXStreet
John Isige is a seasoned cryptocurrency journalist and markets analyst committed to delivering high-quality, actionable insights tailored to traders, investors, and crypto enthusiasts. He enjoys deep dives into emerging Web3 tren


