Litecoin price poised for a volatility burst with a 14% bullish move
- Litecoin price prints a bullish outlook with a double-bottom pattern on the four-hour chart.
- Active addresses grew by 64.43% in October, hinting at a potential volatility spike.
- LTC must regain ground marginally above $53.00 to validate the predicted 14.00% move to $60.61.

Litecoin price is in the green, as is the case with most cryptocurrencies on Monday. The bullish turnaround to $51.92 comes several days after LTC validated a symmetrical triangle breakout to $48.38. All eyes are now fixated on its ability to close the gap to $53.00. A 14.13% bullish move could stem from this breakout point and propel Litecoin price to $60.61.
Network Activity explodes as LTC grinds closer to a breakout
The number of unique addresses transacting on the Litecoin protocol doubled in October. On-chain data from Glassnode shows the cohort’s addresses rose to 530,164, up from 204,464 on October 8.
From the chart below, Litecoin price seems positively correlated to the number of active addresses at any given point. For instance, a drop in the metric from 365,664 in May to 213,205 was concurrently followed by a retracement in LTC price from $69.04 to $54.36.
Similarly, as Litecoin price regained momentum and traded at $63.39 on September 10, the active addresses metric peaked at 408,731.
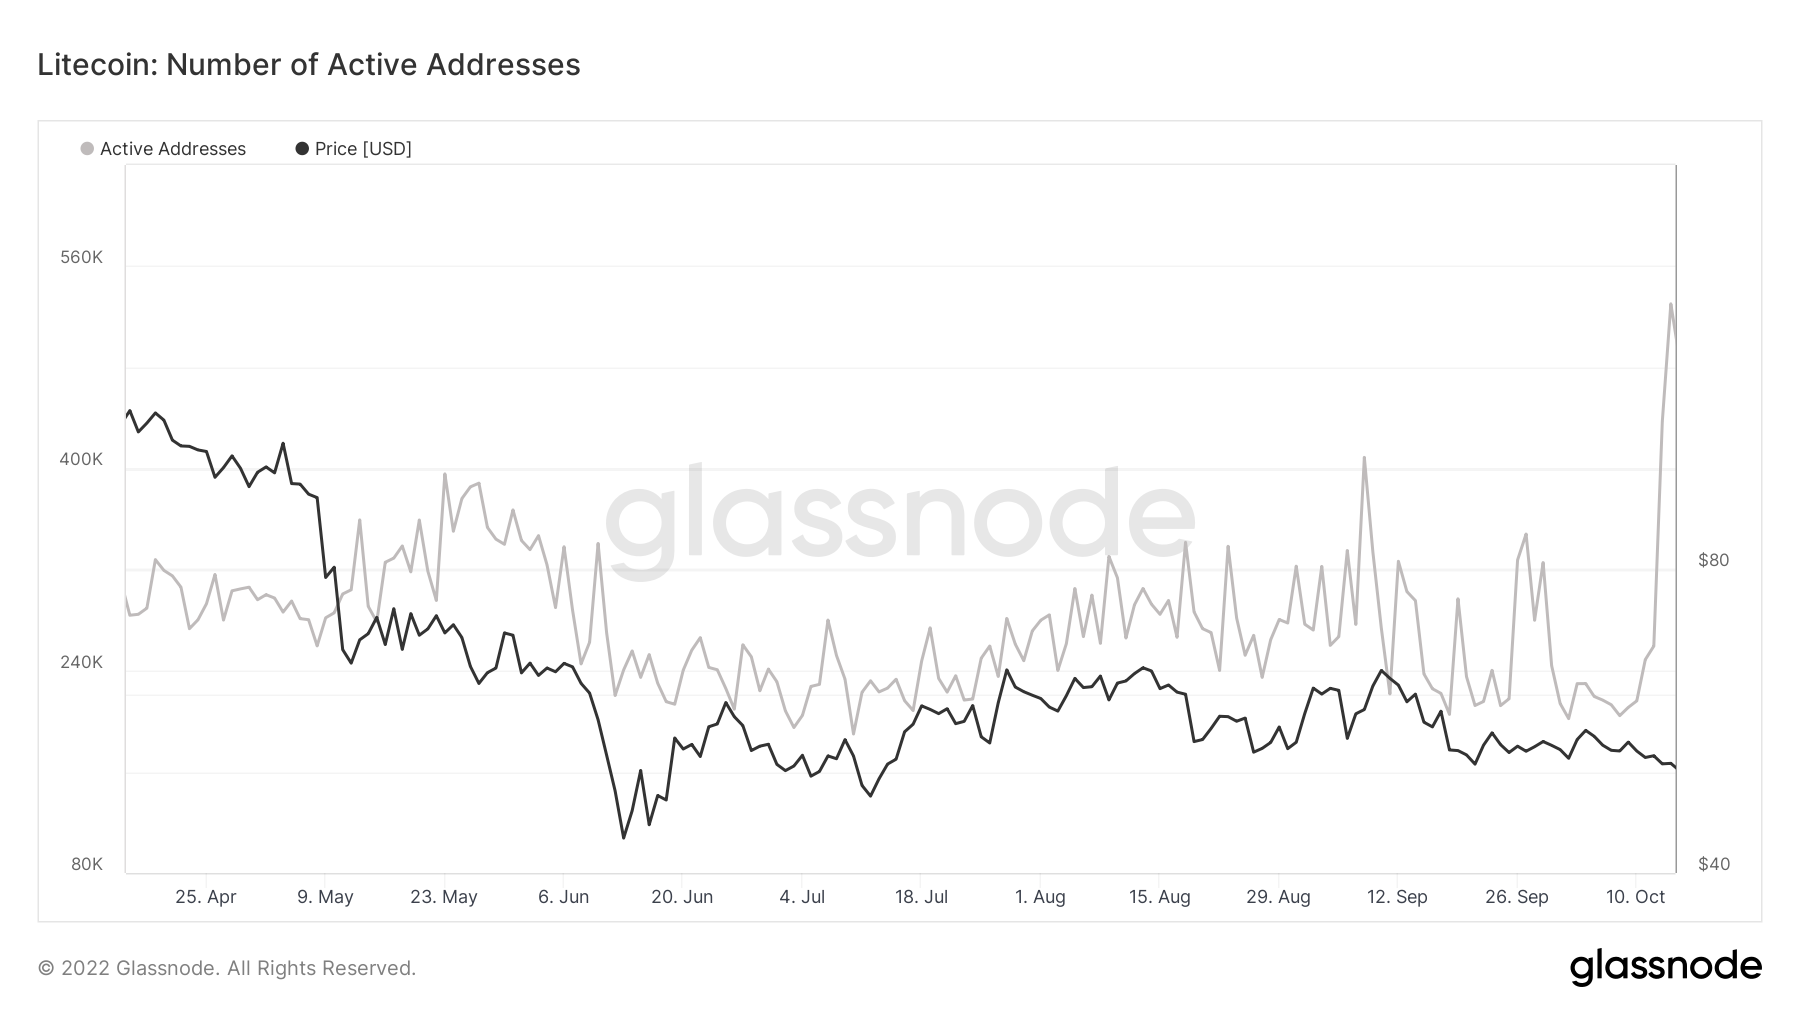
Litecoin Active Addresses
The spike in the number of unique addresses is reflected by investor activity, particularly in supply distribution. According to Santiment, addresses holding between 100 and 1,000 coins grew by 1.37% from 30,188 to 30,600 over the last 30 days. A similar growth pattern was witnessed, with addresses holding between 1,000 and 10,000 coins, which rose from 3,463 to 3,514 – a 1.45% increase.
 [18.03.05, 17 Oct, 2022]-638016183192309337.png)
Litecoin Supply Distribution
Litecoin price rolls down the runway, ready for takeoff
Litecoin price may run into a period of volatility as investors appear to be booking early positions ahead of the potential breakout to $60.61. For this reason, traders must consider a soon-to-be-confirmed double-bottom pattern on the four-hour chart.
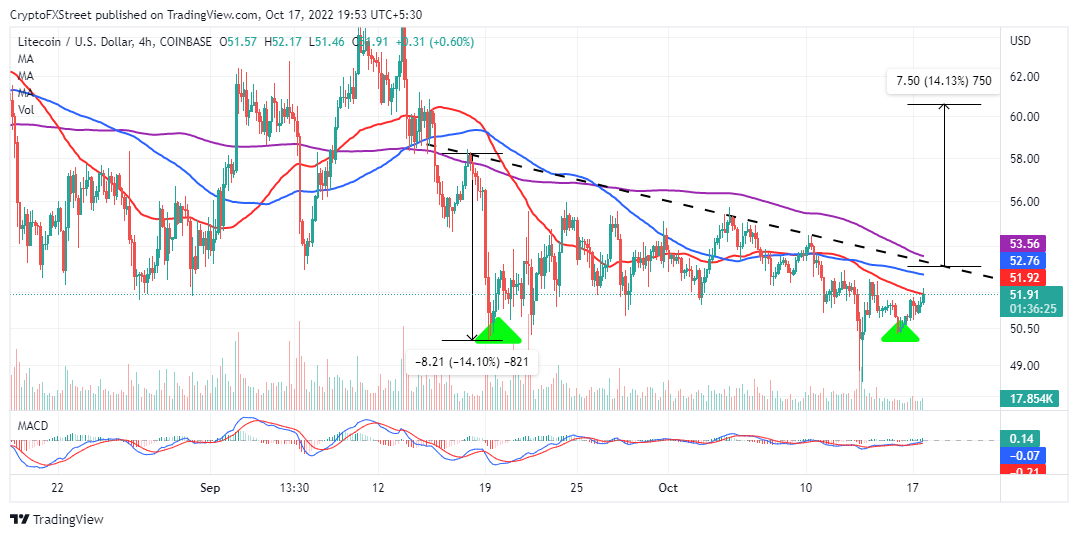
LTC/USD four-hour chart
A double-bottom is a trend reversal formation where traders look for long positions above the breakout point – neckline. Nonetheless, Litecoin price must first battle resistance at the 50-day SMA (Simple Moving Average), red and the seller congestion at $53.00 (neckline) to corroborate a 14.10% move to $60.61.
The MACD (Moving Average Convergence Divergence) adds credence to LTC’s bullish narrative. As the momentum index crosses the mean line, more buyers will make their way into the market. Traders should look for bullish histograms to ascertain the validity of LTC’s uptrend.
Author

John Isige
FXStreet
John Isige is a seasoned cryptocurrency journalist and markets analyst committed to delivering high-quality, actionable insights tailored to traders, investors, and crypto enthusiasts. He enjoys deep dives into emerging Web3 tren


