Litecoin Price Forecast: Whale offloads LTC tokens, raising correction concerns
- Litecoin price faced rejection from its 50-day EMA at $87.55, signaling weakness in the price action.
- Santiment data indicate that a specific whale has been offloading LTC tokens since June 24, increasing selling pressure.
- The technical outlook and negative funding rates support the likelihood of a near-term correction.

Litecoin (LTC) is flashing early signs of a potential correction as bearish signals begin to mount. LTC is hovering around $84 at the time of writing on Wednesday after facing rejection from a key resistance earlier in the week. On-chain data shows that a specific whale wallet has been offloading LTC tokens since June 24, contributing to increased selling pressure. Additionally, the technical analysis and negative funding rates suggest a likelihood of a near-term correction.
LTC whale reduces exposure while funding rates turn negative
Santiment’s Supply Distribution shows that a certain whale wallet holding LTC tokens between 100,000 and 1 million (red line in the chart below) had offloaded 540,000 LTC tokens since June 24, reducing its exposure, which could cause a decline in LTC prices as selling pressure mounts.
 [09-1751435354830.44.25, 02 Jul, 2025].png)
LTC Supply Distribution chart. Source: Santiment
Coinglass’s OI-Weighted Funding Rate data shows that the number of traders betting that the price of Litecoin will slide further is higher than that anticipating a price increase. The metric has flipped a negative rate and reads 0.0062% on Wednesday, indicating that shorts are paying longs. Historically, as shown in the chart below, when the funding rates have flipped from positive to negative, Litecoin’s price has fallen sharply, as seen on June 18.
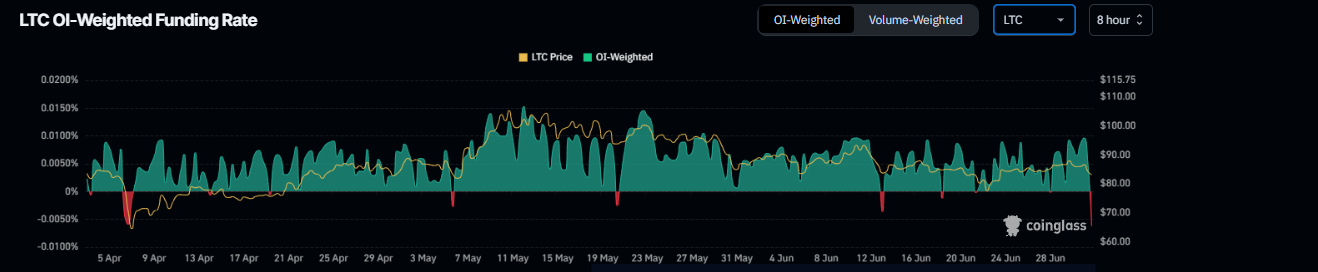
Litecoin OI-Weighted Funding Rate chart. Source: Coinglass
Litecoin Price Forecast: LTC on the verge of a correction
Litecoin’s price faced rejection around the 50-day Exponential Moving Average at $87.55 on Monday and declined by 5.4% until Tuesday. This level coincides with the upper trendline of a falling wedge pattern, making this a key resistance zone. At the time of writing on Wednesday, LTC hovers around $83.79.
If LTC continues its correction, it could extend the decline to retest its weekly support at $77.19.
The Relative Strength Index (RSI) indicator reads 44 on the daily chart, below its neutral level of 50, indicating bearish momentum. The Moving Average Convergence Divergence (MACD) hints at a bearish crossover (the MACD line is close to crossing below the signal line), which, if completed, would give a sell signal.
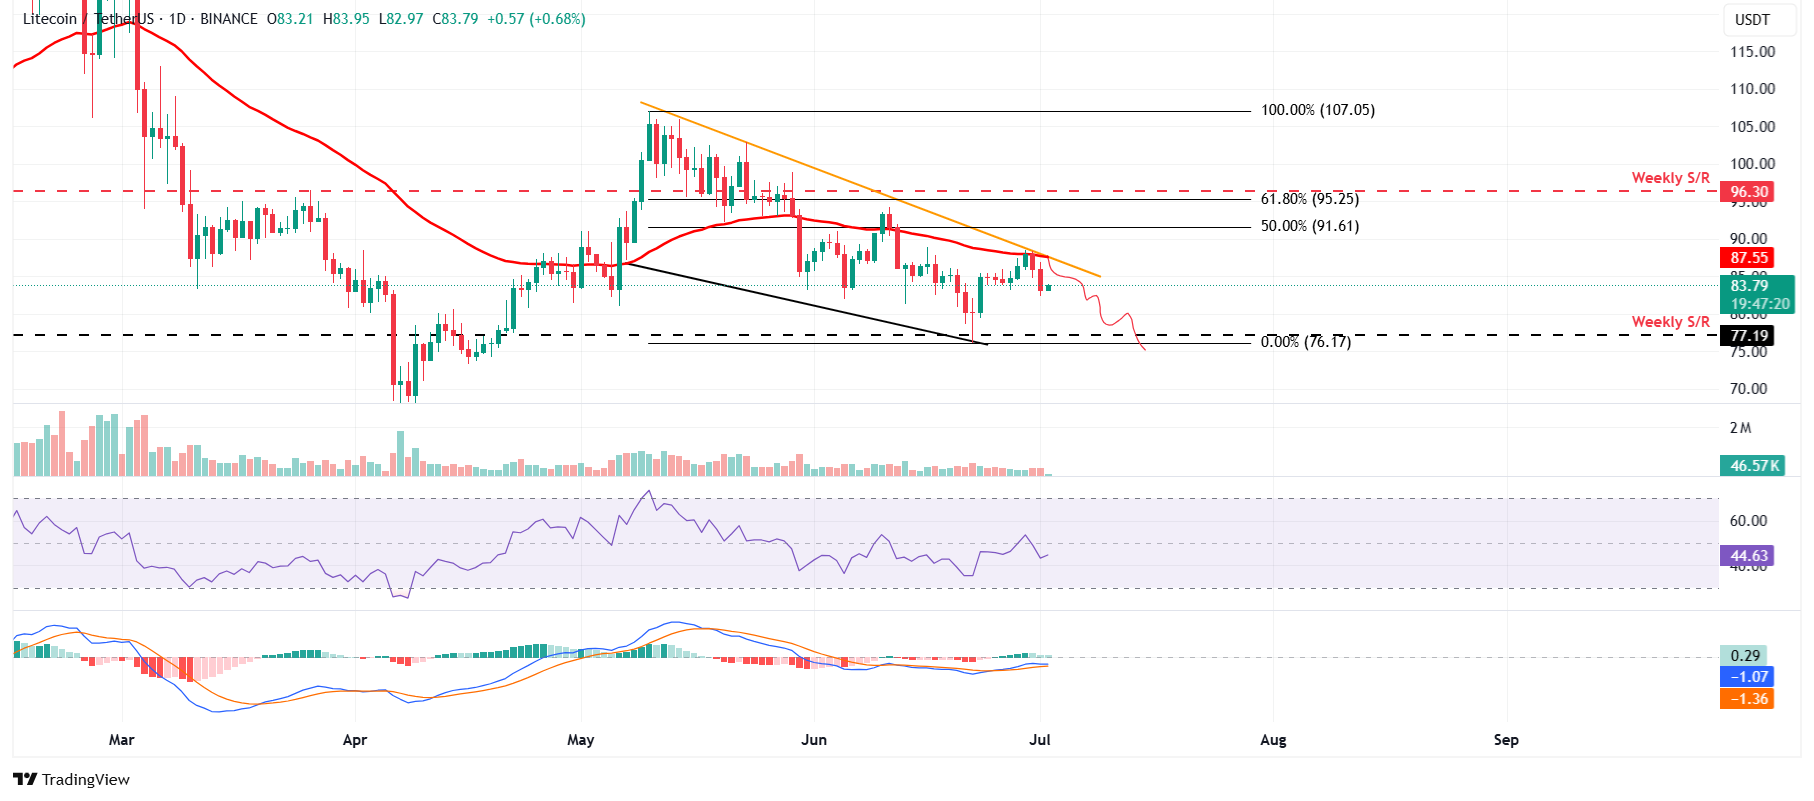
LTC/USDT daily chart
However, if LTC recovers, it could extend the recovery to retest the 50-day EMA at $87.55.
Author

Manish Chhetri
FXStreet
Manish Chhetri is a crypto specialist with over four years of experience in the cryptocurrency industry.


