|

Litecoin price analysis: LTC/USD still range-bound

  • The prevailing trend is bullish but Litecoin is down 0.65% on the day.
  • Litecoin is trading at $89.80 with the immediate upside limited by a confluence around $90.

Litecoin is dancing in the red just like the other major cryptocurrencies. Having opened the session on Tuesday at $90.40, the digital asset’s value ascended to highs at $91.79 before retracing to the current market value of $89.80.

Although the prevailing trend is bullish according to the live rates table, Litecoin is down 0.65% on the day. Looking at the hourly chart, there has been a formidable correction from yesterday’s support at $84.00. In fact, the price stepped above the moving averages as well as the hurdle at $92.00 hitting highs of $92.93.

Another short-term support has been established at $88.00 with $86.00 standing in line to offer support. At the moment, Litecoin is trading at $89.80 with the immediate upside limited by a confluence created by the 100 Simple Moving Average (SMA) 1-h, 50 SMA and the 100 Exponential Moving Average 1-h.

Technical indicators are in favor of the bulls with upside correction expected in the coming sessions. The Relative Strength Index (RSI) continues to trend upwards hinting growth while the Moving Average Convergence Divergence almost crossing into the positive area indicates growing bullish momentum in the near-term.
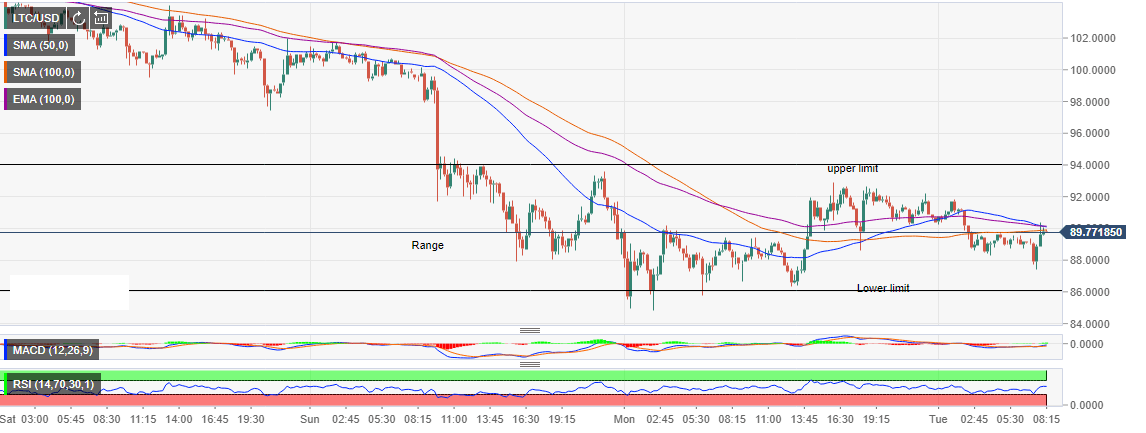
LTC/USD 1-h chart

Author

John Isige

John Isige

FXStreet

John Isige is a seasoned cryptocurrency journalist and markets analyst committed to delivering high-quality, actionable insights tailored to traders, investors, and crypto enthusiasts. He enjoys deep dives into emerging Web3 tren


More from John Isige
Share:

Editor's Picks

Bitcoin Weekly Forecast: BTC retreats as macro headwinds grow
Bitcoin (BTC) remains under pressure, down over 4% this week and trading around $76,900 at the time of writing on Friday. Institutional demand shows signs of weakness as spot BTC Exchange Traded Funds (ETFs) are on track to end their three-week inflow streak, recording nearly $500 million in net outflows through Thursday.
XRP falls toward key support as macro uncertainty, weak momentum cap recovery
Ripple (XRP) falls below $1.33 on Friday, marking the third consecutive day of declines. The token continues to track the broader cryptocurrency market downturn, with investors closely monitoring heightened macroeconomic uncertainty ahead of the United States (US) Consumer Price Index (CPI) release and next week’s Federal Reserve (Fed) monetary policy decision.
Crypto Today: Bitcoin, Ethereum, XRP stabilize at lower levels amid ETF outflows and macroeconomic risks
The broader cryptocurrency market is rising on Friday, with Bitcoin (BTC) trading above $77,000 after testing lower support near $76,500. Ethereum (ETH) shows signs of stability, hovering above the support provided at $2,400 despite capped upside at $2,500. Meanwhile, Ripple (XRP) holds above $1.33 after three straight days of declines, reflecting growing headwinds due to macroeconomic uncertainty.
Bitcoin pulls back as another golden cross fails to deliver
Earlier this week, Bitcoin formed a golden cross, a technical signal that occurs when the price’s 50-day moving average rises above the 200-day moving average and is conventionally viewed as a precursor to a bullish rally. Historically, however, that’s often not been the case.
Bitcoin: BTC retreats as macro headwinds grow
Bitcoin (BTC) remains under pressure, down over 4% this week and trading around $76,900 at the time of writing on Friday. Institutional demand shows signs of weakness as spot BTC Exchange Traded Funds (ETFs) are on track to end their three-week inflow streak, recording nearly $500 million in net outflows through Thursday.


