Litecoin price analysis: LTC/USD is falling at some pace within a descending channel, down over 3% on Tuesday
- LTC/USD price is falling within a descending channel pattern seen on the daily chart.
- Next downside target and support is eyed at $120, resistance tracking at $170.

The Litecoin price is seen down over 3% in trading on Tuesday, continuing its bearish trend that is has been firmly stuck in over the last few weeks. ‘FUD’ remains in the market, not helped by the social media crackdown, with Twitter officially announcing as of now no more ICO ads.
Given the pressure seen across the whole market, there doesn’t look like there will much relief in the short term from the heavy bearish action. During the bull run at the back end of 2017, there was much optimism in the market, a lot of positive news flow doing the rounds, but a lack of so far in 2018.
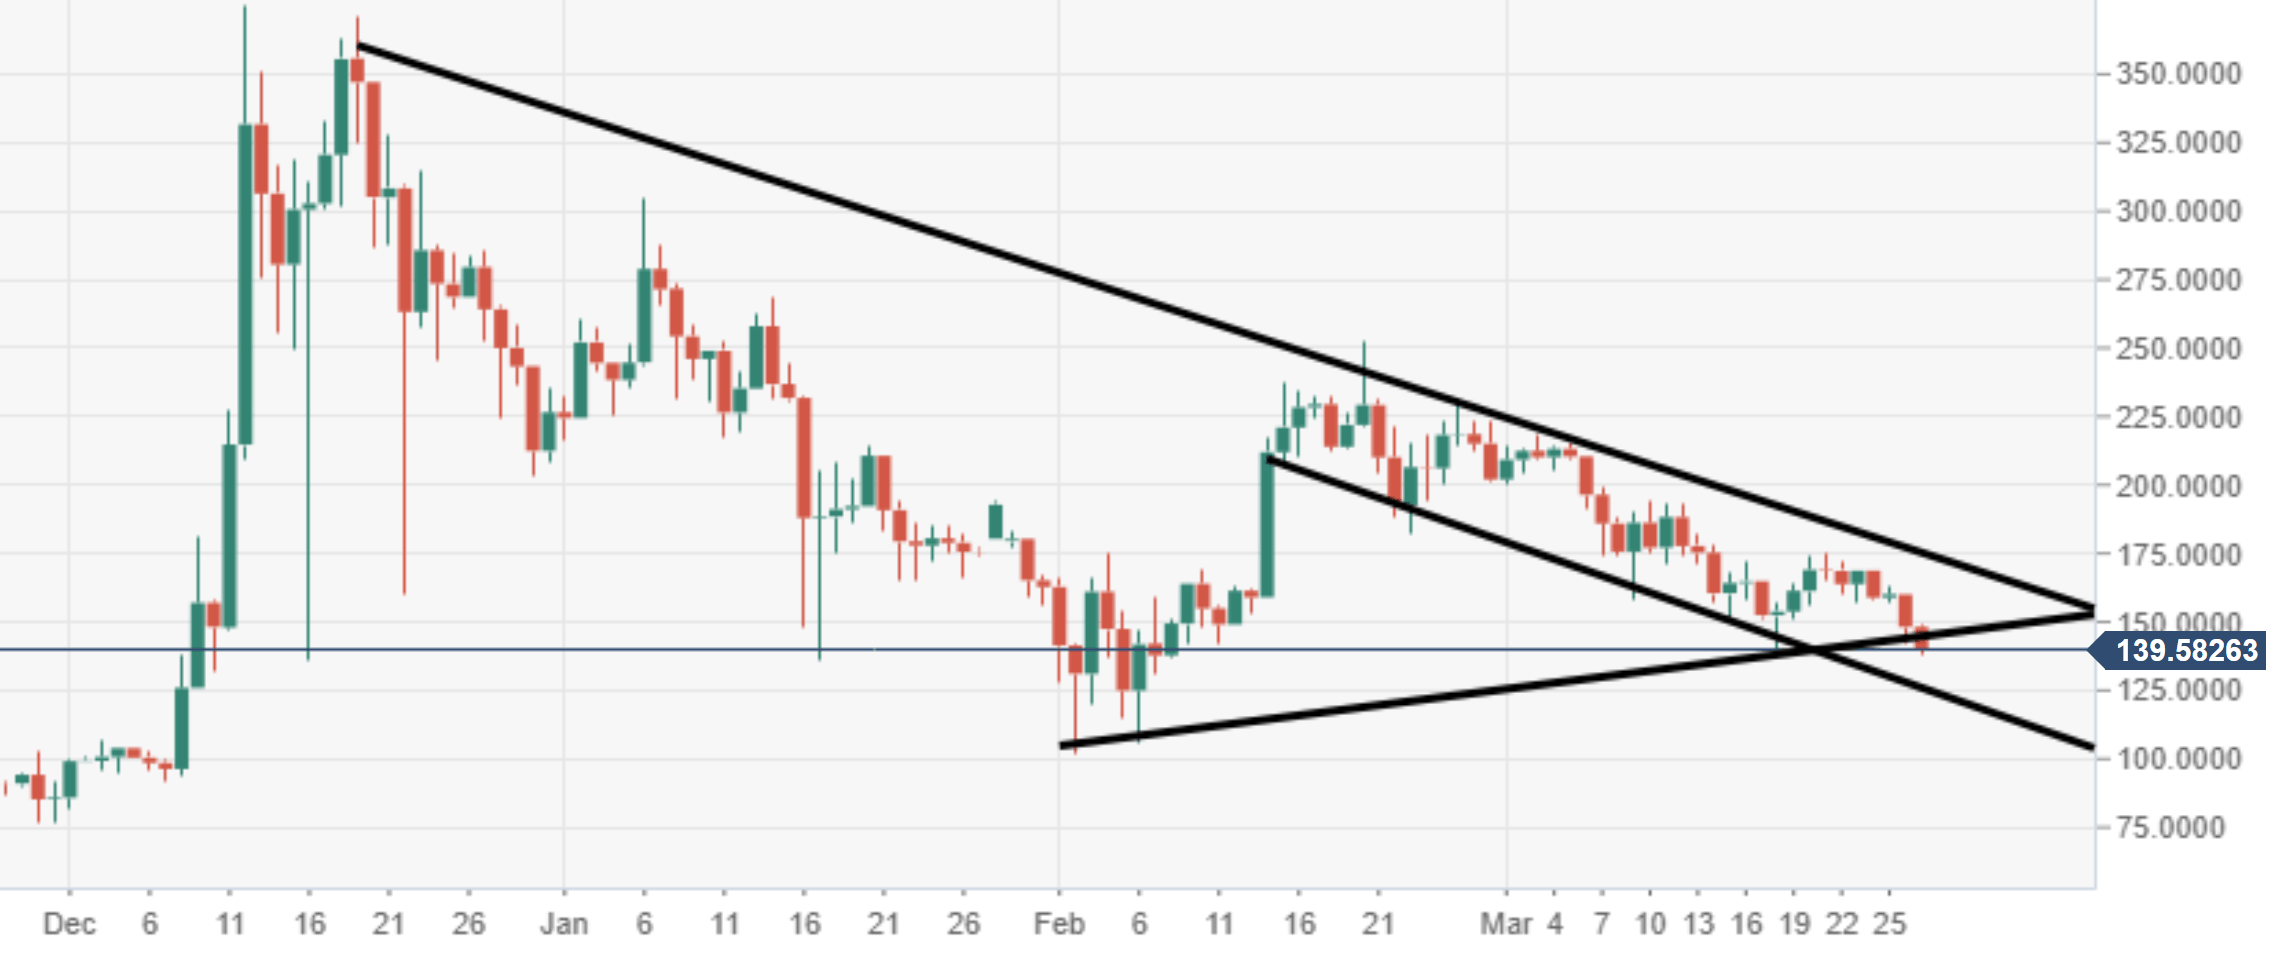
Technically, LTC/USD price is bouncing lower within a descending channel at some pace, its continues to respect the upper trend line of the channel pattern. Litecoin looks to be on its way to test $120 again, next support is seen here. Resistance is currently tracking around $170.
LTC/USD daily chart
Author

Ken Chigbo
Independent Analyst
Ken has over 8 years exposure to the financial markets. He started his career as an analyst, covering a variety of asset classes; forex, fixed income, commodities and equities.


