LINK/USD Elliott Wave technical analysis [Video]
![LINK/USD Elliott Wave technical analysis [Video]](https://editorial.fxstreet.com/images/Markets/Currencies/Cryptocurrencies/Coins/Chainlink/Chainlink_Crypto_31_01_XtraLarge.jpg)
Elliott Wave analysis trading lounge daily chart
LINK/USD Elliott Wave technical analysis
Function: Follow Trend.
Mode: Motive.
Structure: Impulse.
Position: Wave V.
Direction next higher degrees: Wave (I) of Impulse.
Wave cancel invalid level: 8.498.
Details: Wave V is equal to 61.8% of Wave I through Wave III at 23.117.
ChainLink/US Dollar (LINK/USD) trading strategy
The increase in wave ((3)) precedes the correction in wave ((5)) and is at the end of the increase, so watch out for a correction that will occur soon.
ChainLink/ U.S. dollar(LINKUSD)Technical Indicators: The price is above the MA200 indicating an Uptrend, Wave Oscillators a bullish Momentum.
-638441827132385411.png)
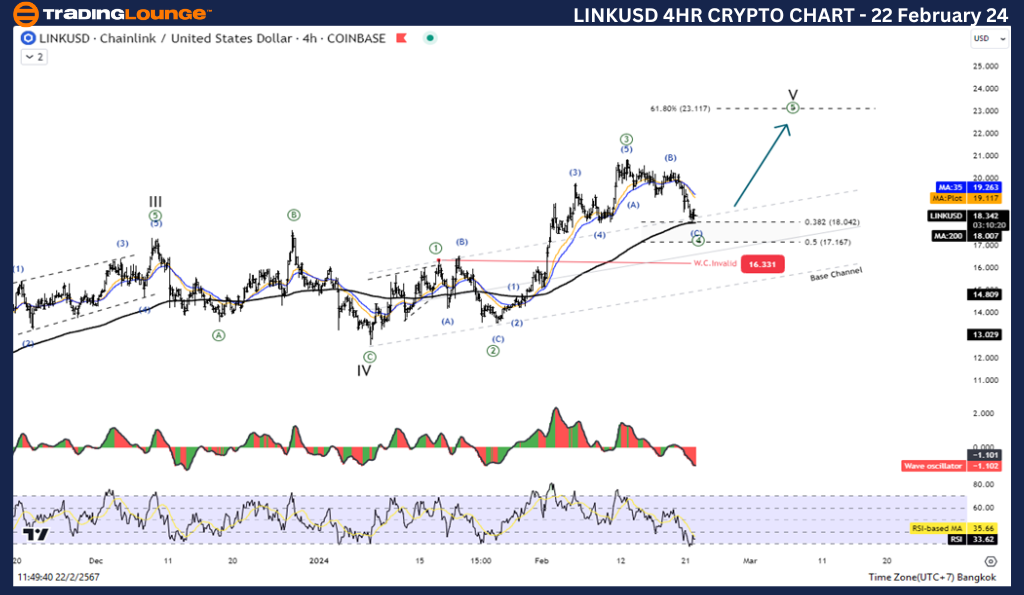
Elliott Wave analysis TradingLounge four hour chart
Function: Follow Trend.
Mode: Motive.
Structure: Impulse.
Position: Wave V.
Direction next higher degrees: Wave (I) of Impulse.
Wave cancel invalid level: 8.498.
Details: Wave V is equal to 61.8% of Wave I through Wave III at 23.117.
ChainLink/US Dollar (LINK/USD) trading strategy
The increase in wave ((3)) precedes the correction in wave ((5)) and is at the end of the increase, so watch out for a correction that will occur soon.
ChainLink/ U.S. dollar(LINKUSD)Technical Indicators: The price is above the MA200 indicating an Uptrend, Wave Oscillators a bullish Momentum.
Author

Peter Mathers
TradingLounge
Peter Mathers started actively trading in 1982. He began his career at Hoei and Shoin, a Japanese futures trading company.


