Kyber Network Price Prediction: KNC screams buy, aiming for $1
- Kyber shows signs of recovery, especially with whales on a buying spree.
- KNC/USD is looking forward to a breakout following the formation of a double-bottom pattern.

Kyber Network recovery hit a wall slightly above $1 towards the end of September. The trading in the first week of October has inclined to the south as Kyber wallowed downstream, searching for a formidable support area. The token explored the rabbit hole towards $0.8. At the time of writing, a reversal appears to be underway, with the token doddering at $0.86.
According to Santiment, a leading provider of on-chain data, whales are enormously increasing their KNC holdings. Moreover, the price is showing signs of decoupling from Bitcoin in regards to short timeframes.
The top $KNC non-exchange address has been in accumulation mode as of late, and the price is showing signs of a decoupling from $BTC this past hour. The address's holdings have jumped from 52.99M to 55.48M (a +4.7% increase) in just the past two weeks. https://t.co/PPBqDwdW8a pic.twitter.com/Xln0VrdJqa
— Santiment (@santimentfeed) October 5, 2020
KNC bulls regain control
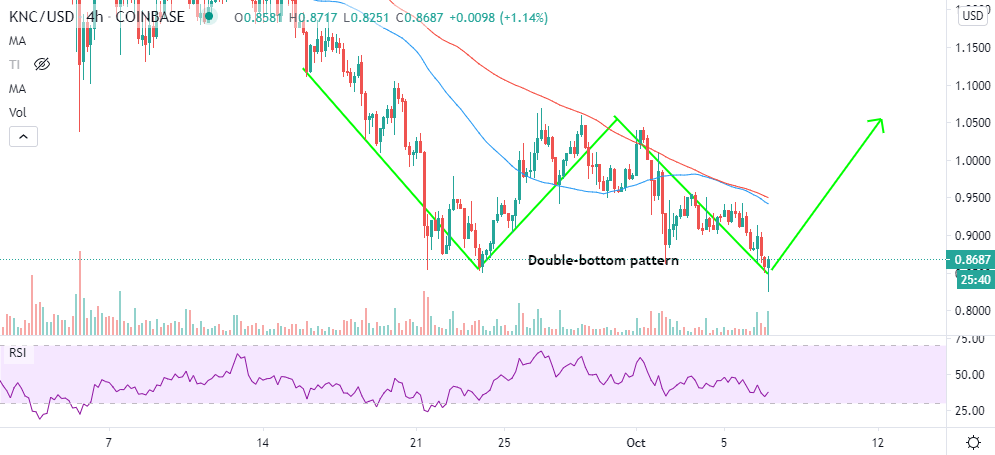
The breakdown to $0.8 highlights a double-bottom pattern, as illustrated in the 4-hour timeframe. This pattern is used in technical analysis to explain a possible change in the trend and momentum. A double-bottom shows an initial drop in an asset's price, followed by a rebound and another drop to the same level as the first drop. The lower level, tested twice, is considered strong support, leading to a significant rebound.
In this case, the double-bottom pattern signals a potential rebound to areas above $1. The return of the bulls is emphasized by the upward trending Relative Strength Index (RSI). As long as the trend strength indicator sustains the motion heading to the overbought area, buy orders are bound to increase, creating more volume and validating the bullish narrative. It is essential to keep in mind that the seller congestion at the 50 Simple Moving Average (SMA) and the 100 SMA in the 4-hour range will absorb some of the buying pressure, delaying the uptrend.
KNC/USD 4-hour chart
Santiment's holder distribution metric highlights a shift in the focus of the whales. Since September 22, addresses holding between 100,000 and 1 million KNC have formed a series of higher highs. Initially, the selling pressure absorbed all the buying pressure, hence the drop in the price. However, with the addresses topping 80 by October 7, a reversal in the price is coming into the picture.
KNC holder distribution chart
 holder distribution-637376392967265734.png)
IntoTheBlock's IOMAP model highlights an increasing bearish grip to $1. The most robust resistance lies between $0.86 and $0.94. Previously, 1,800 addresses purchased 18 million KNC in the range. The zone seems strong enough to absorb most of the buying pressure currently in the market.
Kyber Network IOMAP model
-637376393982226597.png)
On the downside, the model reveals the lack of formidable support. Therefore, it is likely that the uptrend described in the technical analysis will be sabotaged. However, the most significant support runs from $0.67 to $0.74. Here, 1,900 addresses bought $1.2 million KNC.
Looking at the other side of the picture
It is worth mentioning that recovery to $1 will not be a walk in the park, especially with the 50 SMA still expanding the gap below the longer-term 100 SMA in the 4-hour timeframe. In other words, the sellers' influence in the market cannot be ignored. Simultaneously, IntoTheBlock's IOMAP chart highlights the growing resistance towards $1. Recovery is likely to delay because investors in these resistance zones will be on the lookout to capitalize on their positions to profit.
Author

John Isige
FXStreet
John Isige is a seasoned cryptocurrency journalist and markets analyst committed to delivering high-quality, actionable insights tailored to traders, investors, and crypto enthusiasts. He enjoys deep dives into emerging Web3 tren


