Is the Safemoon price warning investors of a future rug pull?
- Safemoon price fails to break out from a descending parallel channel.
- SFM price has experienced a death cross of the 8- and 21-day simple moving averages.
- Invalidation of the bearish trend is dependent on a breach above the parallel channel currently positioned at $0.0006050.

Safemoon price shows signs of failure. More decline is expected unless the bulls can hurdle the descending trendline.
Safemoon price looks fatigued
Safemoon price could experience more decline as the bulls are being tested at the psychological $0.0005000 level. The bulls established a strong rally during the second week of June. On June 15, a large bullish engulfing candle pierced through the descending parallel channel. Unfortunately, the trend's break showed no follow-up as the bears have now reconquered the profit-taking. consolidation breaching more than 50% of the entire rally.
Safemoon price currently trades at $0.0004856. A break below the $0.00050000 could become the catalyst to send the Safemoon price an additional 20% lower into the $0.0004000 levels. The 8- and 21-day moving averages provide confluence of the bearish outlook as a death cross has been witnessed on the 3-day chart. The bulls will need to step in very soon to oppose the demise of the Safemoon price as death crosses' are notorious for producing steep erratic price action in the cryptocurrency market.
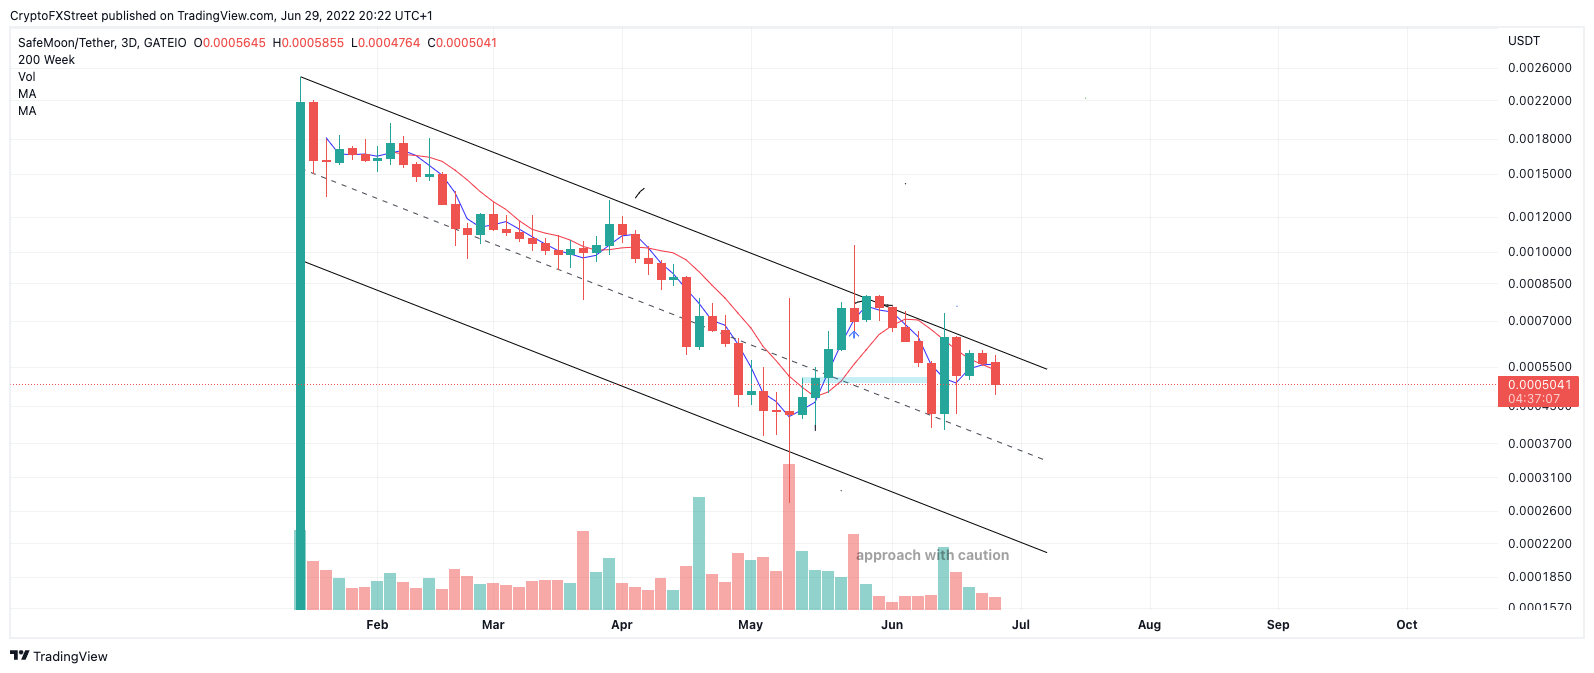
SFM/USDT 3-Day Chart
Invalidation of the bearish trend remains a breach and close above the descending parallel channel currently positioned at $0.0006050. If the bulls can conquer this critical barrier, the May $0.0010358 swing high will be a potential bullish target resulting in a 110% increase from the current Safemoon price.
Author

Tony M.
FXStreet Contributor
Tony Montpeirous began investing in cryptocurrencies in 2017. His trading style incorporates Elliot Wave, Auction Market Theory, Fibonacci and price action as the cornerstone of his technical analysis.


