- SafeMoon price underwent a firm rejection on Monday after a bearish cross in the moving averages.
- SFM price sees the sell-off contained with price action underpinned at the fibo-level.
- Expect to see a pop higher as bulls squeeze out bears and rally 36%.
SafeMoon (SFM) price is set to continue its stalled rally after a break below the green ascending trend line in mid-May. Although price action has been trading to the downside, it remains underpinned, even after the rejection by the 21-day Simple Moving Average (SMA) and although the 9-day SMA has crossed below the 21-day SMA, in a short-term death cross, considered a bearish signal by traders. Expect to see a pop higher, as markets shift to risk on and price action remains underpinned around the 61.8% Fibonacci level. The Relative Strength Index (RSI) is also flatlining, ready to jump higher again which would fall in line with SafeMoon popping back to $0.000900000.
SFM price set to rally 36%
SafeMoon price has been in a downtrend since Sunday after price action got caught between the 9-day SMA and the 55-day SMA. Since then, price action has been trading lower, but without a daily close below the 55-day SMA. This is clear evidence that bulls are still paying and a factor underpinning price action. That said, bulls are now aware that they need to look out for the small death cross which has formed after the 9-day SMA moved below the 21-day SMA. The 21-day SMA is also a difficult moving level as price action already failed to break above on two consecutive days with a clear rejection of the daily candle on both Sunday and Monday.
SFM price is likely to see bulls fighting back, with support in their corner coming from that 55-day SMA and the 61.8% Fibonacci level at $0.000611824. Expect bears to get squeezed-out with bulls needing to execute a daily close above the 21-day SMA at $0.000744489. SFM price would then be able to rally another leg higher towards $0.000900000 and make a possible new high for June. That would translate into an 18% gain from the level of the 21-day SMA or 36% from where the SFM price is trading currently.
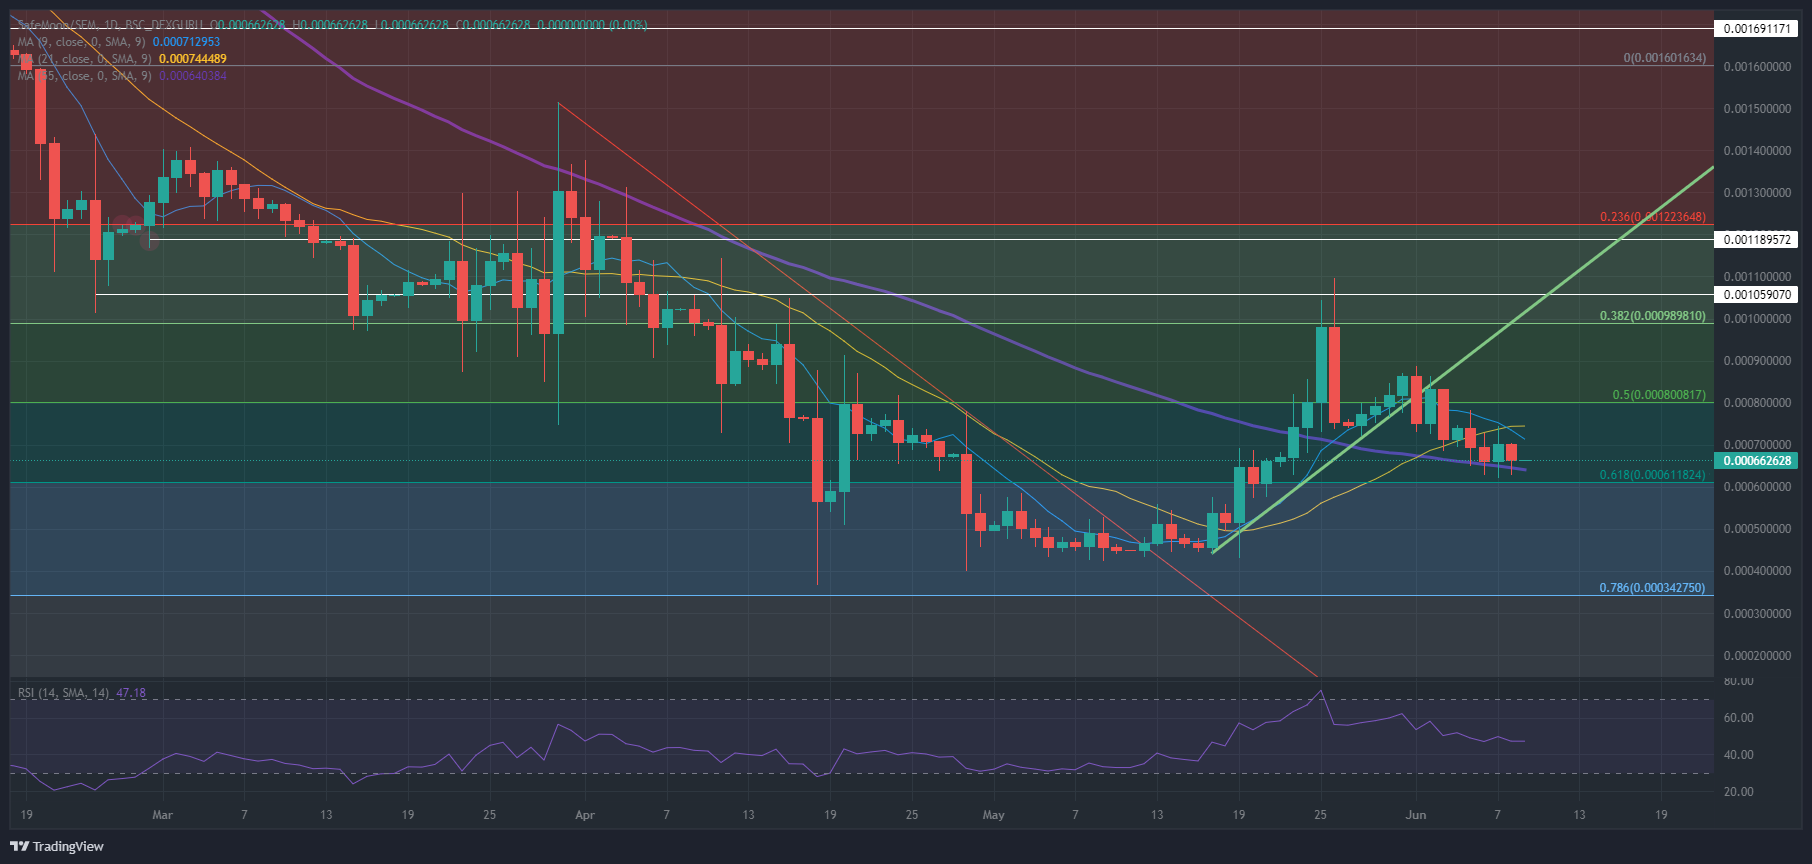
SFM/USD daily chart
Another rejection from the 21-day SMA would be fatal for the bulls and could see them squeezed out against that double floor of the 55-day SMA and the 61.8% Fibonacci level at $0.000611824. A break below would open the door to further declines, and in a worst-case scenario see a drop of 45% back to $0.000342750, in the process erasing all incurred gains for 2022. But that scenario would need a global market catalyst that triggers massive risk-off across the board.
Information on these pages contains forward-looking statements that involve risks and uncertainties. Markets and instruments profiled on this page are for informational purposes only and should not in any way come across as a recommendation to buy or sell in these assets. You should do your own thorough research before making any investment decisions. FXStreet does not in any way guarantee that this information is free from mistakes, errors, or material misstatements. It also does not guarantee that this information is of a timely nature. Investing in Open Markets involves a great deal of risk, including the loss of all or a portion of your investment, as well as emotional distress. All risks, losses and costs associated with investing, including total loss of principal, are your responsibility. The views and opinions expressed in this article are those of the authors and do not necessarily reflect the official policy or position of FXStreet nor its advertisers. The author will not be held responsible for information that is found at the end of links posted on this page.
If not otherwise explicitly mentioned in the body of the article, at the time of writing, the author has no position in any stock mentioned in this article and no business relationship with any company mentioned. The author has not received compensation for writing this article, other than from FXStreet.
FXStreet and the author do not provide personalized recommendations. The author makes no representations as to the accuracy, completeness, or suitability of this information. FXStreet and the author will not be liable for any errors, omissions or any losses, injuries or damages arising from this information and its display or use. Errors and omissions excepted.
The author and FXStreet are not registered investment advisors and nothing in this article is intended to be investment advice.
Recommended Content
Editors’ Picks
Prisma price tanks 25% after nearly $9 million exploit
Prisma Finance (PRISMA) is being exploited, and the attacker has so far pulled $9 million in Ethereum from the borrowing protocol. Prisma asked vault owners to take the necessary steps to protect funds from the ongoing attack in an official tweet on X.
Meme coins gain traction after SEC’s partial win in Coinbase lawsuit: DOGE, SHIB, BRETT, POPCAT, BODEN
US SEC pocketed a partial win in its lawsuit against Coinbase, ushering a correction in crypto prices on Thursday. Despite the broad pullback, prices of meme coins like Dogecoin, Shiba Inu and Solana-based BRETT, POPCAT and BODEN increased.
Ondo moves $95 million worth of OUSG assets to BUIDL as tokenized fund attracts $245 million since debut
Ondo Finance (ONDO) announced on Wednesday that it's shifting about $95 million worth of its OUSG's underlying assets to the BlackRock USD Institutional Digital Liquidity Fund (BUIDL).
XRP price stuck below $0.65 resistance, Ripple lawsuit could suffer from Coinbase defeat
XRP price falls slightly to $0.61 on Thursday after its landmark programmatic sales ruling in July, which gave Ripple a partial victory against the US SEC, failed to reverberate in a similar legal battle between the regulator and crypto exchange Coinbase.
Bitcoin: BTC may have recovered, but is it out of the woods?
Bitcoin’s (BTC) upward momentum has shown a significant decline for the past two weeks or so. This development led to a bearish signal on the weekly and an uncertain outlook on the monthly.