|

Is Matic price setting up a bear trap? Subtle cues hint at a $2.10 target

  • Matic price signals a desire for a countertrend rally.
  • Polygon price prints a bullish hammer candle on the weekly chart.
  • Invalidation of the bullish idea is a breach of $0.34.

Matic price could surprise the crypto market as the Polygon ecosystem could be prepping for a massive rebound to $2.10.

Matic price displays subtle bullish cues.

MATIC price could be the "sleeper" coin within the crypto market as the price action displays distinct differences from most other coins in the space. The weekly close has printed a bullish hammer candle with a bearish color. The anomaly presented by the weekly candlestick could suggest smart money involvement in the Polygon price.

MATIC price displays an increase in volume for the current bullish hammer. If the technicals are correct, the Matic price could be trying to establish a countertrend rally into the $2.10 zone as a b wave rally. On smaller time frames, traders should look for a bullish breach of a previous 4th wave degree to provide an appropriate entry signal while placing safety stops at this year's swing low, currently marked at $0.51. The swing low is subject to change if any market fakeouts occur. 

Tm/MATIC/5/16/22

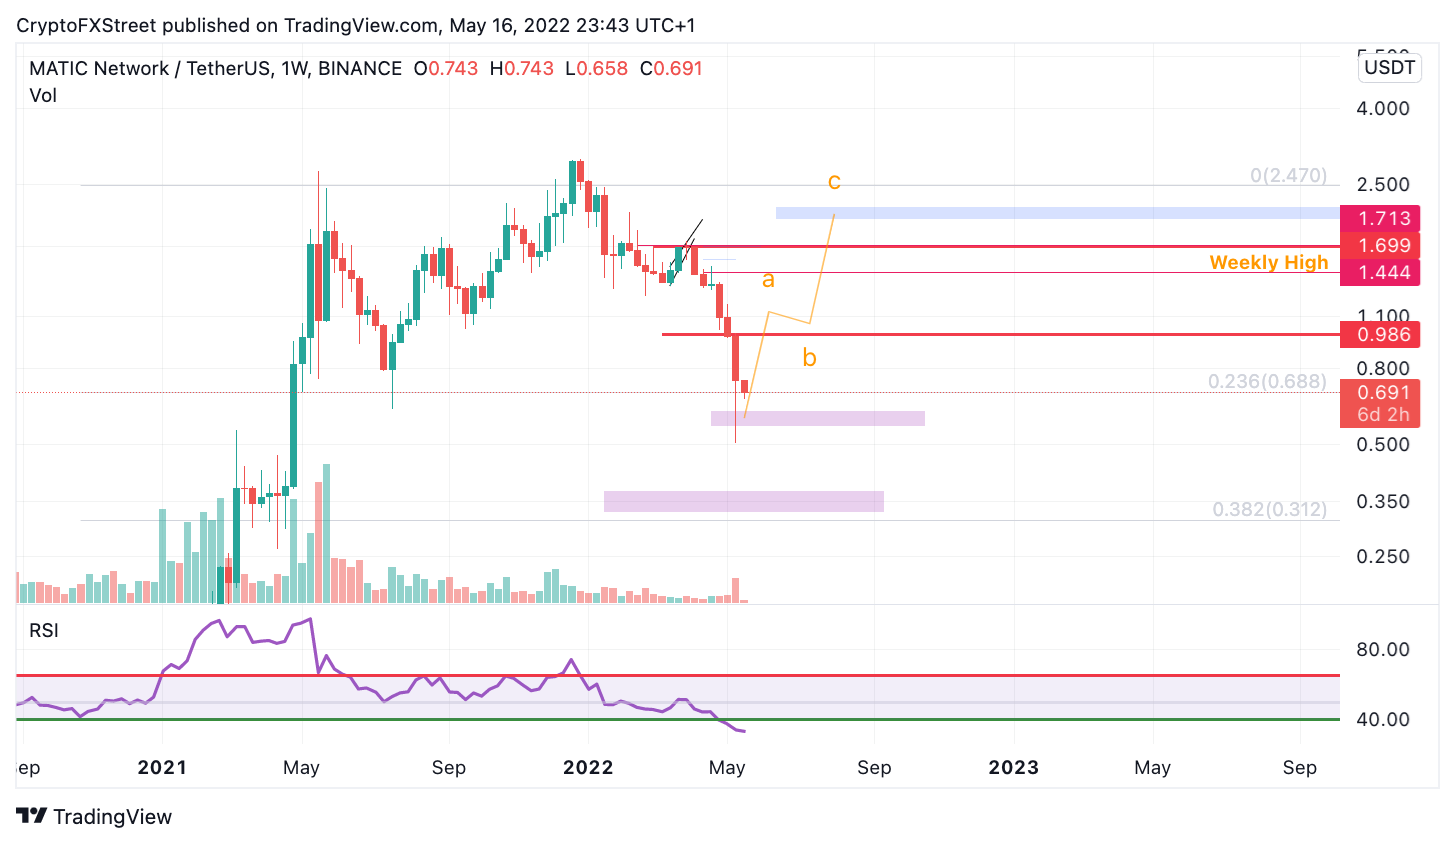
MATIC/USDT 1-Week Chart

The safer invalidation for swing traders uninterested in intraday trading is a breach below the large bullish engulfing candle from May 2021 at $0.34. If the bears breach this level, consider the entire thesis void. The bears could continue heading south towards $0.20, resulting in a 75% decrease from the current MATIC price.

Author

Tony M.

Tony M.

FXStreet Contributor

Tony Montpeirous began investing in cryptocurrencies in 2017. His trading style incorporates Elliot Wave, Auction Market Theory, Fibonacci and price action as the cornerstone of his technical analysis.

More from Tony M.
Share:

Editor's Picks

Bitcoin slips below $75,000 as selling pressure accelerates

Bitcoin (BTC) price falls below the $75,000 mark on Monday, having corrected nearly 11% in the previous week and reaching level not seen in nearly 10 months. Market momentum has clearly turned bearish, with technical indicators pointing to further downside toward the next key support at $70,000.

Top 3 Price Prediction: Bitcoin, Ethereum, and Ripple weakness persists after massive correction

Bitcoin, Ethereum and Ripple trade in red on Monday after dipping by over 11%, 19% and 13%, respectively, in the previous week. The top three cryptocurrencies have shed 10%, 17%, and 10.5% in the first month of 2026, highlighting persistent downside pressure.

Top Crypto Losers: Monero, Ethereum, and Kaspa face intense sell-off

Altcoins, including Monero, Ethereum, and Kaspa, are leading the broader cryptocurrency market decline with a steep correction on Sunday. Monero and Ethereum are close to critical support levels near $400 and $2,300, respectively.

Solana Price Forecast: SOL slips below $100, risks deeper correction

Solana (SOL) price extends its correction, trading below $100 on Monday after losing more than 15% in the previous week. The bearish price action is further backed by derivatives data, which shows rising short bets and negative funding rates.

Bitcoin Price Annual Forecast: BTC holds long-term bullish structure heading into 2026

Bitcoin (BTC) is wrapping up 2025 as one of its most eventful years, defined by unprecedented institutional participation, major regulatory developments, and extreme price volatility.

Bitcoin: BTC correction deepens as Fed stance, US-Iran risks, mining disruptions weigh

Bitcoin (BTC) price extends correction, trading below $82,000 after sliding more than 5% so far this week. The bearish price action in BTC was fueled by fading institutional demand, as evidenced by spot Exchange-Traded Funds (ETFs), which recorded $978 million in inflows through Thursday.