IOTA price analysis: This fall has some more way down to go
- Breaks down lower in line with other cryptos.
- Some more pain left.

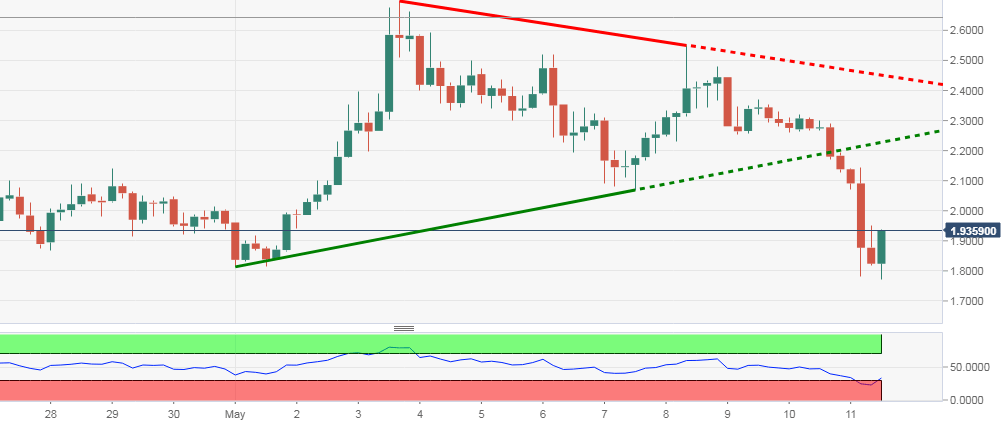
IOTA price has broken lower of the triangle pattern on the short term charts and there is some more pain left in this downfall after the failed falling wedge breakout of Thursday which lacked momentum to go higher.
IOT/USD is down 10 percent on day at $1.910 but recovered a lot from the lows of the day, which was at $1.771. On the 240-minute chart IOT has broken lower of a triangle pattern after falling below the lower trendline at $2.20. Traget for the breakdown is somewhere close to $1.40.
Strong resistance for IOT now stands at $2.14 in the form of 21 days SMA. Solace for bulls for now is nearly oversold RSI which might result in consolidation before it goes lower further.
IOT/USD 240-minute chart:
Author

Manoj B Rawal
Independent Analyst
Manoj B Rawal, financial markets professional with about 11 years of experience in writing, editing and advising on stocks, currencies and fixed income.


