Hyperliquid updates validator to 21 permissionless nodes, HYPE price breaks out
- Hyperliquid’s validator update allows anyone to register, with the 21 largest stakes forming the active set.
- Validators must lock up 10,000 HYPE for one year, whether in the active set or not.
- Hyperliquid price breaks out and holds the 100-day EMA as support as bulls look beyond $20.
- The RSI indicator’s uptrend signals increasing bullish momentum amid growing open interest in the derivatives market.

Hyperliquid (HYPE) price moves higher and trades at $18.45 in the early European session on Tuesday, buoyed by news of the protocol opening the validator program to all network users, capped at 21 permissionless nodes. Select indicators highlight a stronger technical structure likely to keep HYPE elevated and heading for gains above $20.00.
Hyperliquid validators to lock 10,000 HYPE for one year
Hyperliquid developers announced an update on the network’s validator to 21 permissionless nodes on Tuesday, giving all users in the ecosystem a chance to register and participate in securing the protocol. Although open to everyone, the updated validator will automatically pick the 21 largest by stake, forming the active asset. According to an X post revealing the update, “delegations from the Delegation Program are expected to go live in the coming days.”
Validators have been encouraged to familiarise themselves with the technology on the testnet before advancing to the mainnet. Moreover, the team said that “the self-delegation of 10,000 HYPE is locked by the protocol for one year.” The lockup will apply to all validators, even if the validator does not form the active set. Therefore, users should carefully consider the commitment before staking.
The validator set has been updated to 21 permissionless nodes. Anyone can register a validator, and the 21 largest by stake form the active set. Delegations from the Delegation Program are expected to go live in the coming days.
— Hyper Foundation (@HyperFND) April 22, 2025
Technical details for validators:
Validators…
Hyperliquid’s price reacted with a minor bullish jolt, increasing by more than 1% on the day to trade at $18.45 at the time of writing. Over the last two weeks, HYPE has been sustaining a bullish outlook, doubling its value from the April 7 low at $9.30.
Interest in the layer-1 token is gradually rising based on derivatives data. According to Coinglass, open interest (OI) increased 4% to approximately $584 million in the last 24 hours. Open interest refers to the number of active derivatives contracts that have yet to be settled.
The increase in HYPE’s OI could mean more market participation with more open positions, driving inflows into the market. Traders expect the price to rise along with the open interest and liquidity.
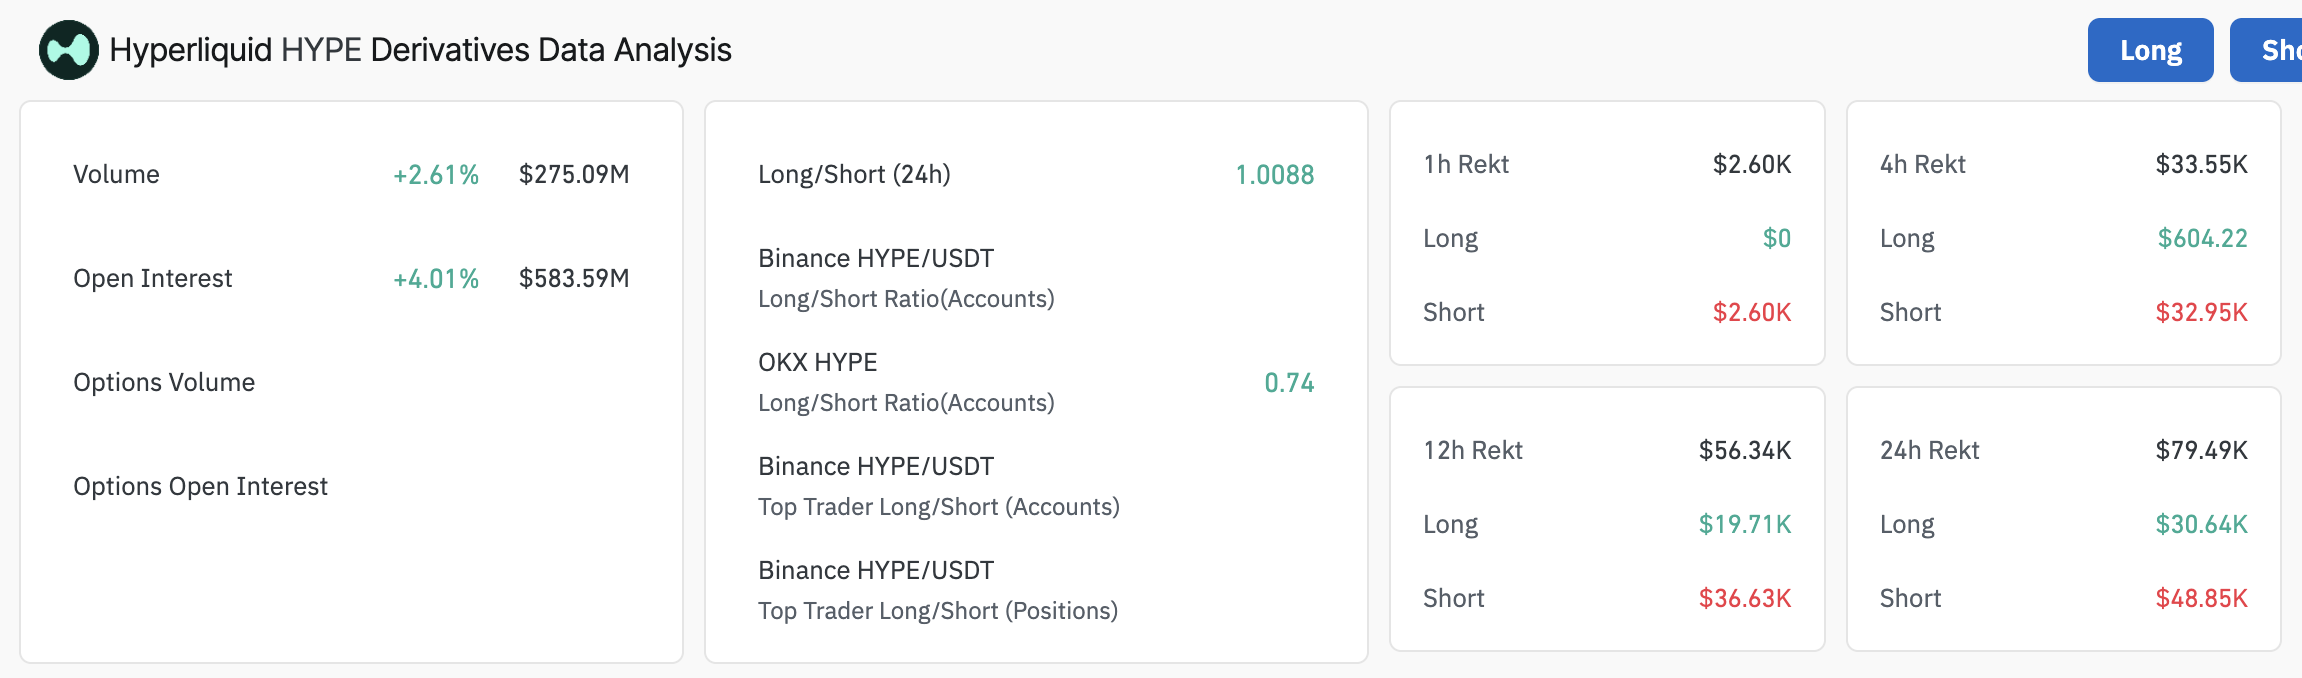
HYPE derivatives data | Source: Coinglass
A 1:1 long-to-short ratio suggests that market sentiment is balanced, with traders equally split between bullish and bearish bets. However, liquidation data shows that more traders are closing their short positions, possibly leaning towards backing the uptrend in Hyperliquid’s price. Roughly $49,000 in short positions has been liquidated in the last 24 hours compared to approximately $31,000 in long positions.
Hyperliquid uptrend inches closer to $20
The path with the least resistance shifted upward following the rebound from the April 7 low of $9.30. HYPE now sits above the 50-day Exponential Moving Average (EMA) at $16.05.
At the same time, the token breached two more resistance levels in the daily chart, including the upper range limit (red on the chart below) and the descending trendline. The Relative Strength Index (RSI) indicator’s position at 64.41, pointing toward the overbought region, highlights strong bullish momentum.
Sustained support above the 100-day EMA at $18.34 would encourage traders to hold their positions, thus providing a tailwind for HYPE’s ascent above $20.00.
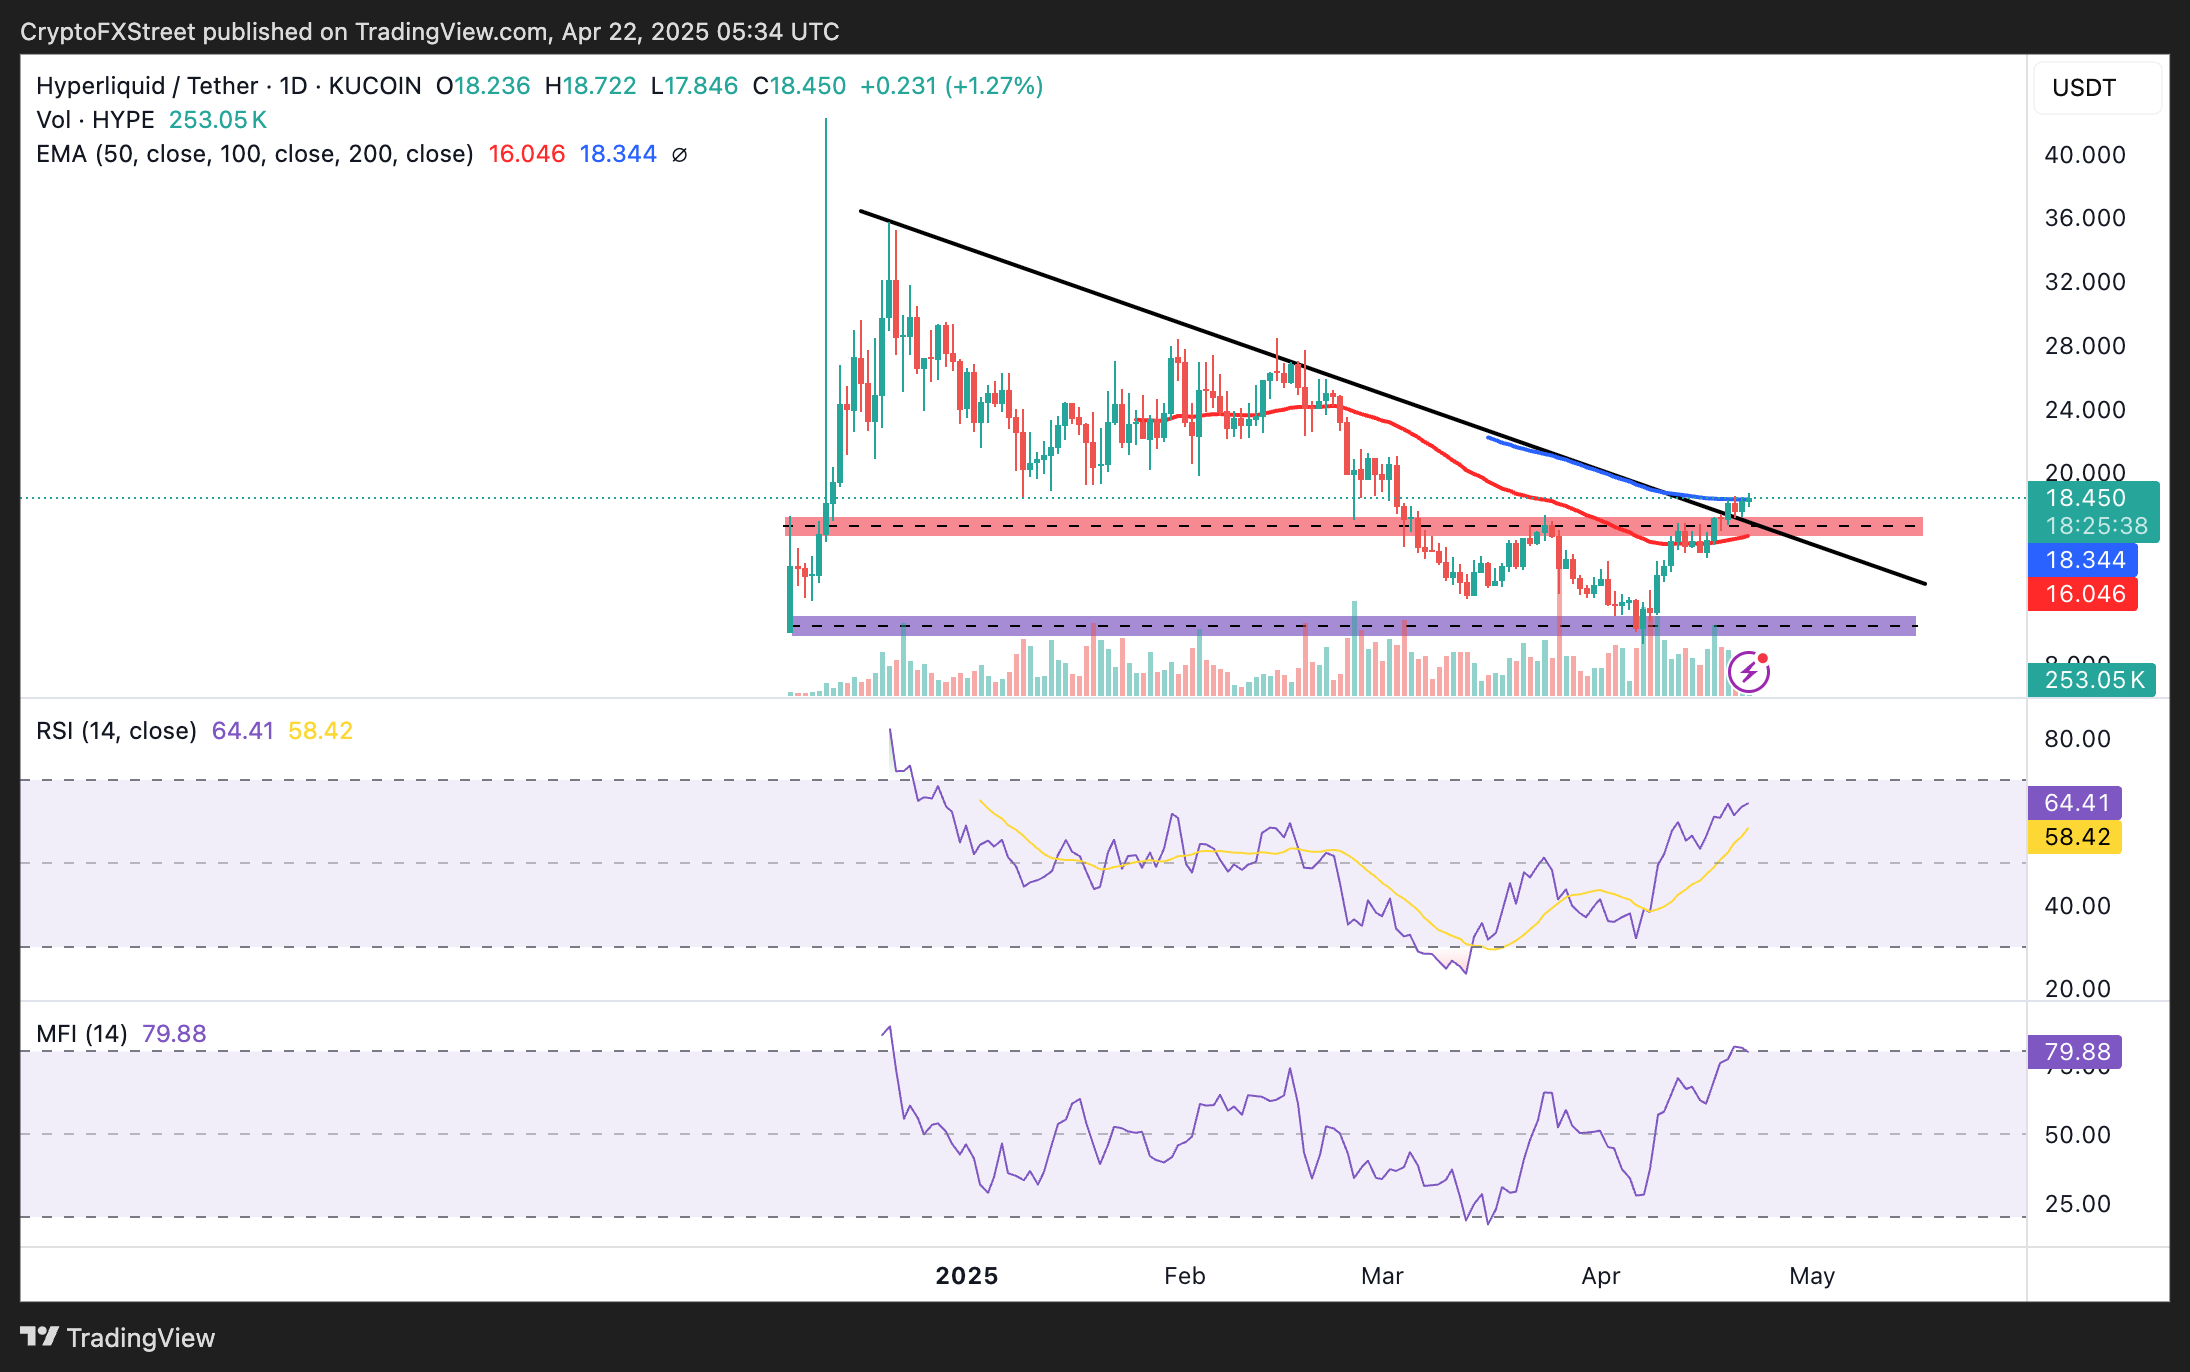
HYPE/USDT daily chart
On the other hand, the Money Flow Index (MFI) indicator, which measures the flow of money in and out of Hyperliquid, is nearly overbought at 79.88, calling for caution as some traders could realize profits, increasing sell-side pressure and weakening the bullish momentum.
In case of a trend reversal, the 50-day EMA will come in handy to prevent another dive to retest April’s lowest price point.
Author

John Isige
FXStreet
John Isige is a seasoned cryptocurrency journalist and markets analyst committed to delivering high-quality, actionable insights tailored to traders, investors, and crypto enthusiasts. He enjoys deep dives into emerging Web3 tren


