Hyperliquid Price Forecast: Bulls head toward fresh all-time high
- Hyperliquid price extends its gains on Monday after rallying around 18% last week.
- Derivatives data show that HYPE’s Open Interest reached a new all-time high, and bullish bets are rising.
- The technical outlook suggests a new all-time high at around $46.35.

Hyperliquid (HYPE), the decentralized perpetual trading platform and Layer 1 blockchain, trades inches away from its all-time high of $44 on Monday after a nearly 18% rally last week. Derivatives data support the bullish thesis, as Open Interest (OI) has reached a new all-time high, while the technical setup projects prices to reach $46.35.
Hyperliquid’s bullish bets rise
Coinglass’ data shows that the futures’ OI in HYPE at exchanges rose from $1.79 billion on Sunday to $1.97 billion on Monday, a new all-time high (ATH). An increasing OI represents new or additional money entering the market and new buying, which could drive Hyperliquid’s price to a new all-time high.
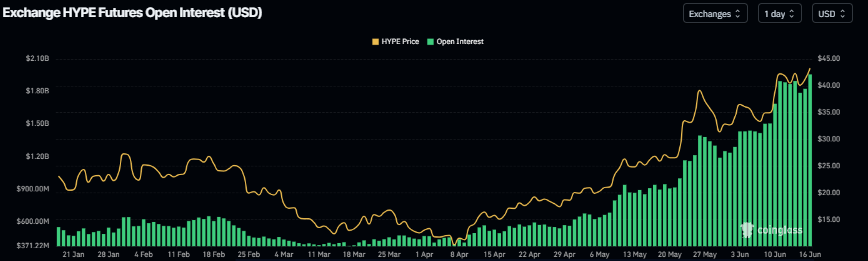
HYPE Open Interest chart. Source: Coinglass
Another bullish sign is Coinglass’s long-to-short ratio, which reads 1.20, the highest level in over a month. This ratio, above one, reflects bullish sentiment in the markets, as more traders are betting on the Hyperliquid price to rise.
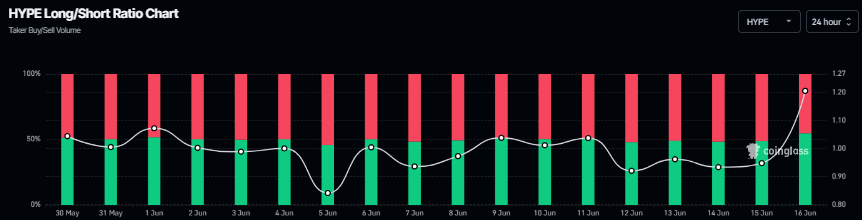
HYPE long-to-short ratio chart. Source: Coinglass
Hyperliquid Price Forecast: HYPE bulls target record high at $46
Hyperliquid price reached a new all-time high of $44.08 on Wednesday and declined slightly the following day. However, HYPE price retested and found support around the daily level of $39.11 on Saturday and rose slightly the next day. At the time of writing on Monday, it continues to trade higher by 5% and heads toward its ATH of $44.08.
If HYPE continues its upward trend, it could extend the rally to set a new ATH of $46.35, the 141.40% Fibonacci extension drawn from the December high of $35.51 to the April low of $9.32.
The Relative Strength Index (RSI) reads 68, which is above its neutral level of 50 but below its overbought level of 70, indicating strong bullish momentum. The Moving Average Convergence Divergence (MACD) indicator also displayed a bullish crossover last week , giving buy signals and suggesting a continuation of an upward trend.
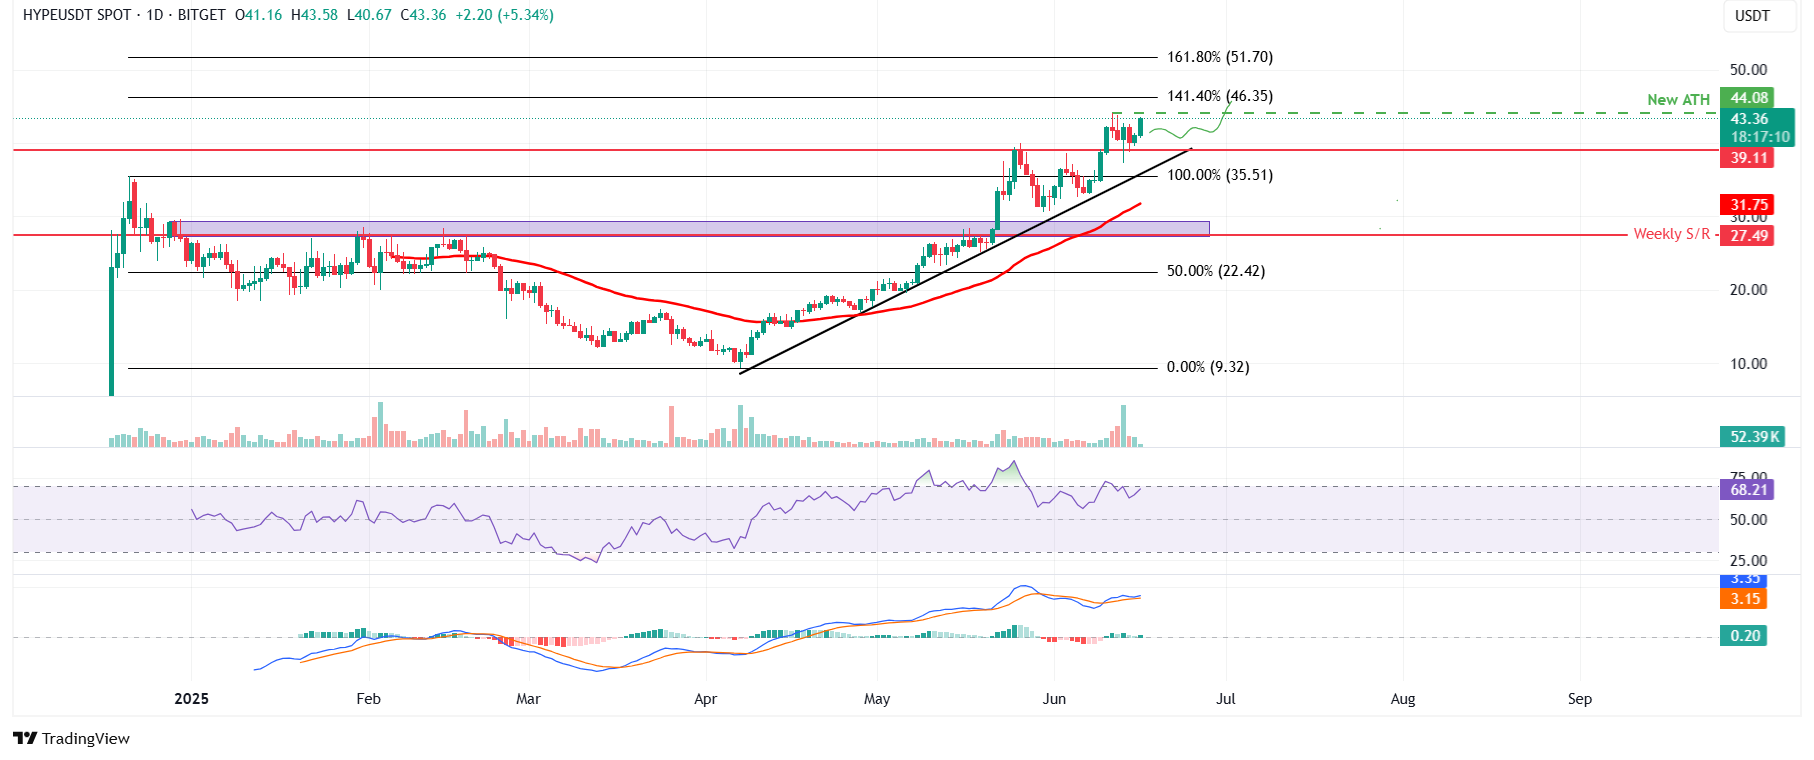
HYPE/USDT daily chart
In case of a correction, HYPE could decline to find support around its daily level of $39.11.
Author

Manish Chhetri
FXStreet
Manish Chhetri is a crypto specialist with over four years of experience in the cryptocurrency industry.


