Hyperliquid Price Forecast: HYPE inches toward its all-time high, breakout to $46 in sight
- Hyperliquid price trades around $39.41, just 1.5% shy of its all-time high of $39.96.
- On-chain and derivatives data show that HYPE’s Open Interest and Total Value Locked are rising.
- The technical outlook suggests a new all-time high at around $46.35.

Hyperliquid (HYPE), the decentralized perpetual trading platform and Layer 1 blockchain, is extending its gains on Tuesday, just inches away from the all-time high (ATH) of $39.96. On-chain and derivatives data support the price rally as HYPE’s Open Interest (OI) and Total Value Locked (TVL) are rising. Meanwhile, the price action suggests a new all-time high (ATH) at around $46.35.
HYPE’s open interest and TVL suggest a bullish bias
Coinglass’ data shows that the futures’ OI in HYPE at exchanges rose from $1.42 billion on Saturday to $1.69 billion on Tuesday, a new all-time high (ATH). An increasing OI represents new or additional money entering the market and new buying, which could fuel the current rally in Hyperliquid’s price.
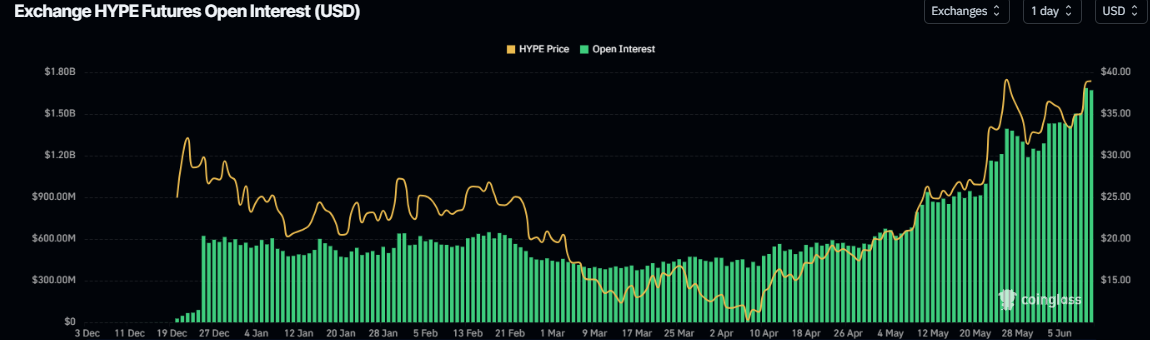
HYPE Open Interest chart. Source: Coinglass
Data from crypto intelligence tracker DefiLlama shows that on Tuesday, HYPE’s layer 1 TVL reached a new all-time high of $1.97 billion. This increase in TVL indicates growing activity and interest within the Hyperliquid ecosystem, suggesting that more users are depositing or utilizing assets within HYPE-based protocols.
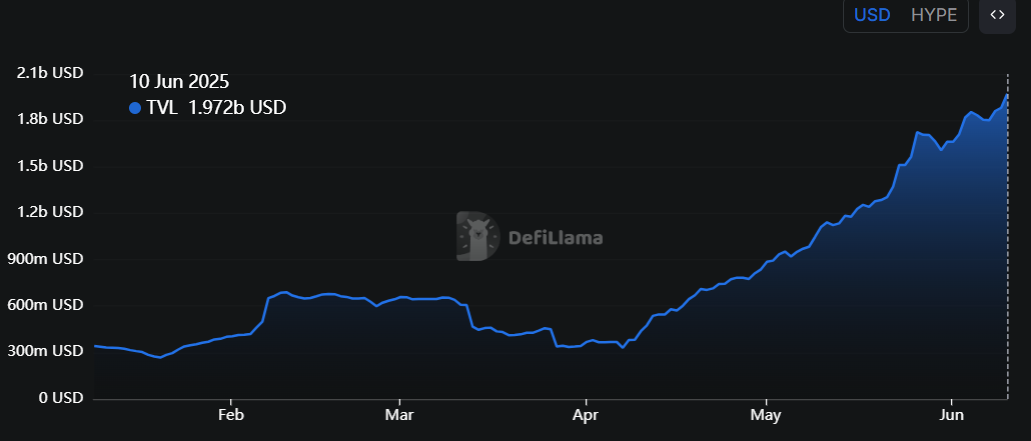
HYPE TVL chart. Source: DefiLlama
Hyperliquid Price Forecast: HYPE bulls target the $46 mark
Hyperliquid price recovered more than 16% since Saturday and closed around $38.80 on Monday. At the time of writing on Tuesday, it continues to trade higher, approaching its all-time high at $39.96.
If HYPE continues its upward trend, it could extend the rally to $46.35, the 141.40% Fibonacci extension drawn from the December high of $35.51 to the April low of $9.32.
The Relative Strength Index (RSI) on the daily chart reads 68, above its neutral level of 50 and below its overbought level of 70, indicating strong bullish momentum. However, traders should be cautious, as the chances of a pullback increase when overbought levels are reached.
The Moving Average Convergence Divergence (MACD) indicator is about to flip a bullish crossover on the daily chart. If the MACD generates a bullish crossover, it will provide a buying signal and indicate an upward trend.
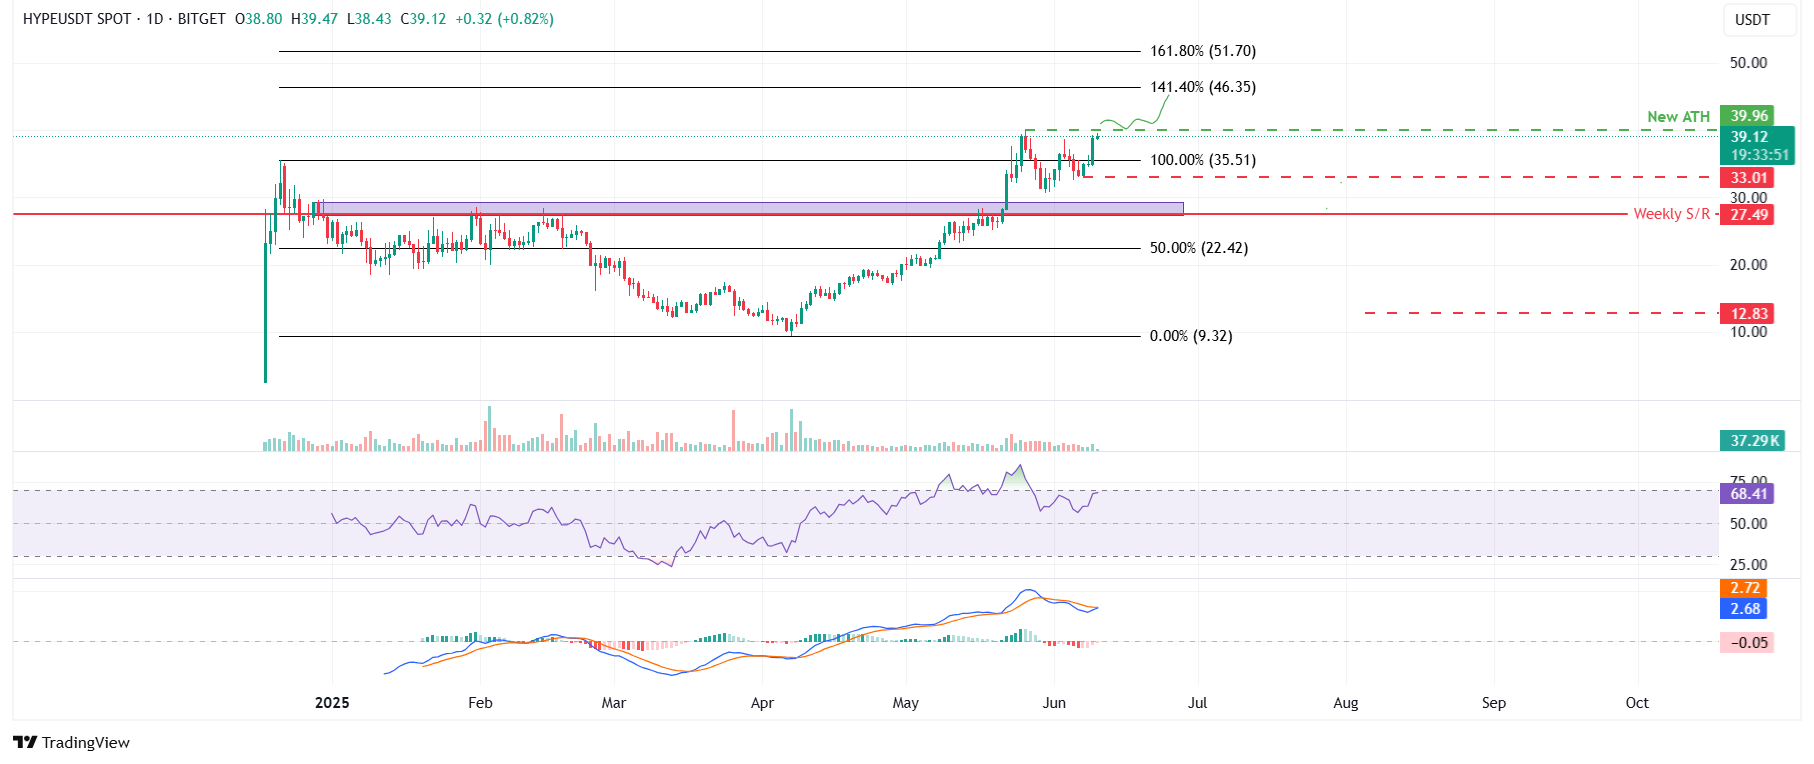
HYPE/USDT daily chart
However, if HYPE faces a correction, it could extend the decline to find support around its previous low of $33.01 on Saturday.
Author

Manish Chhetri
FXStreet
Manish Chhetri is a crypto specialist with over four years of experience in the cryptocurrency industry.


