How will Zilliqa price react to the $0.04 level
-
ZIL price has breached the parallel trend channel.
-
Zilliqa price shows early evidence of a classic ramping volume pattern.
- Invalidation of the bearish downtrend is a breach at $0.07.

Zilliqa price is undergoing a harsh sell-off. The $0.04 support zone could induce a pullback, but the amount of strength displayed by the bears leaves room for reasonable doubt.
Zilliqa price proposes reasonable doubt
Zilliqa price is currently undergoing a severe sell-off as the price has fallen 45% in one day. Zilliqa price has recently breached a parallel channel as the price currently trades at $0.049. The $0.04 zone has considerable support from the bulls, and since this is the first re-acquaintance in this zone since the all-time high, a countertrend reaction could occur. However, the Zilliqa price displays some concerning signals that could stunt the cataclysm.
Zilliqa price shows bearish confidence as the volume profile is beginning to coil into a classic ramping pattern on the daily chart. The bears are progressively printing larger bearish candles on the daily chart, fueling the pessimistic flame. Zilliqa price will need to display very strong bullish price action or consolidate for weeks before a clear bullish signal is shown.
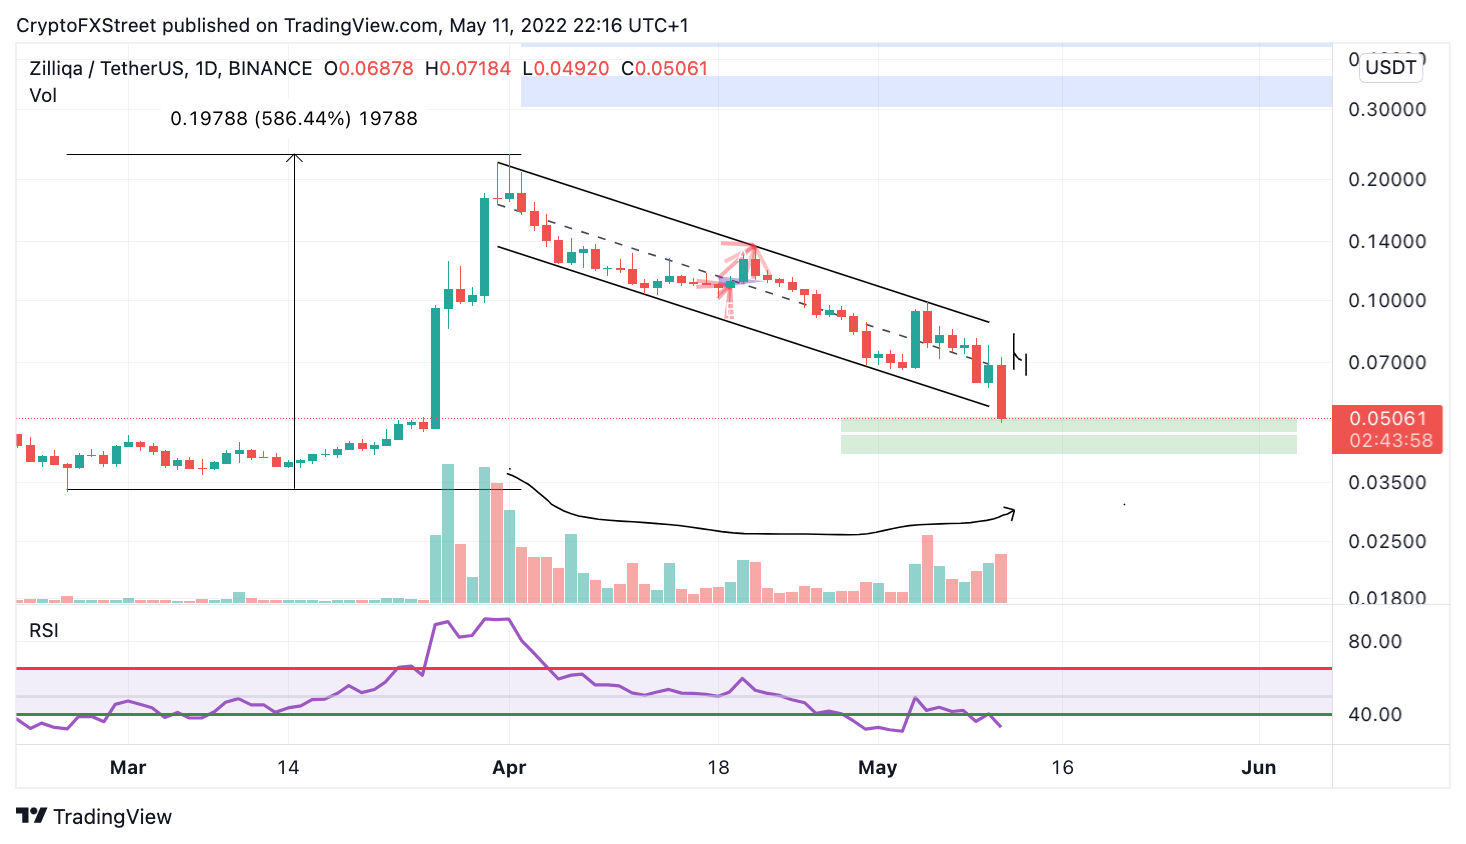
ZIL/USDT 1-Day Chart
Still, invalidation is always possible for any trend. The earliest evidence of a sustainable countertrend rally will be a break back into the median parallel trend line at $0.07. A $0.12 countertrend target could be back on the cards if this were to occur, resulting in a 150% increase from the current Zilliqa price.
Author

Tony M.
FXStreet Contributor
Tony Montpeirous began investing in cryptocurrencies in 2017. His trading style incorporates Elliot Wave, Auction Market Theory, Fibonacci and price action as the cornerstone of his technical analysis.


